
Chart Overlays
September 19th, 2023 by Matt
We're thrilled to present the latest enhancements to the Messari Chart Overlays!
- Enhanced Availability:
- Chart overlays are now accessible for Enterprise users across various sections, including the homepage, asset page, and asset drawers within the Screener tool and the Asset section.
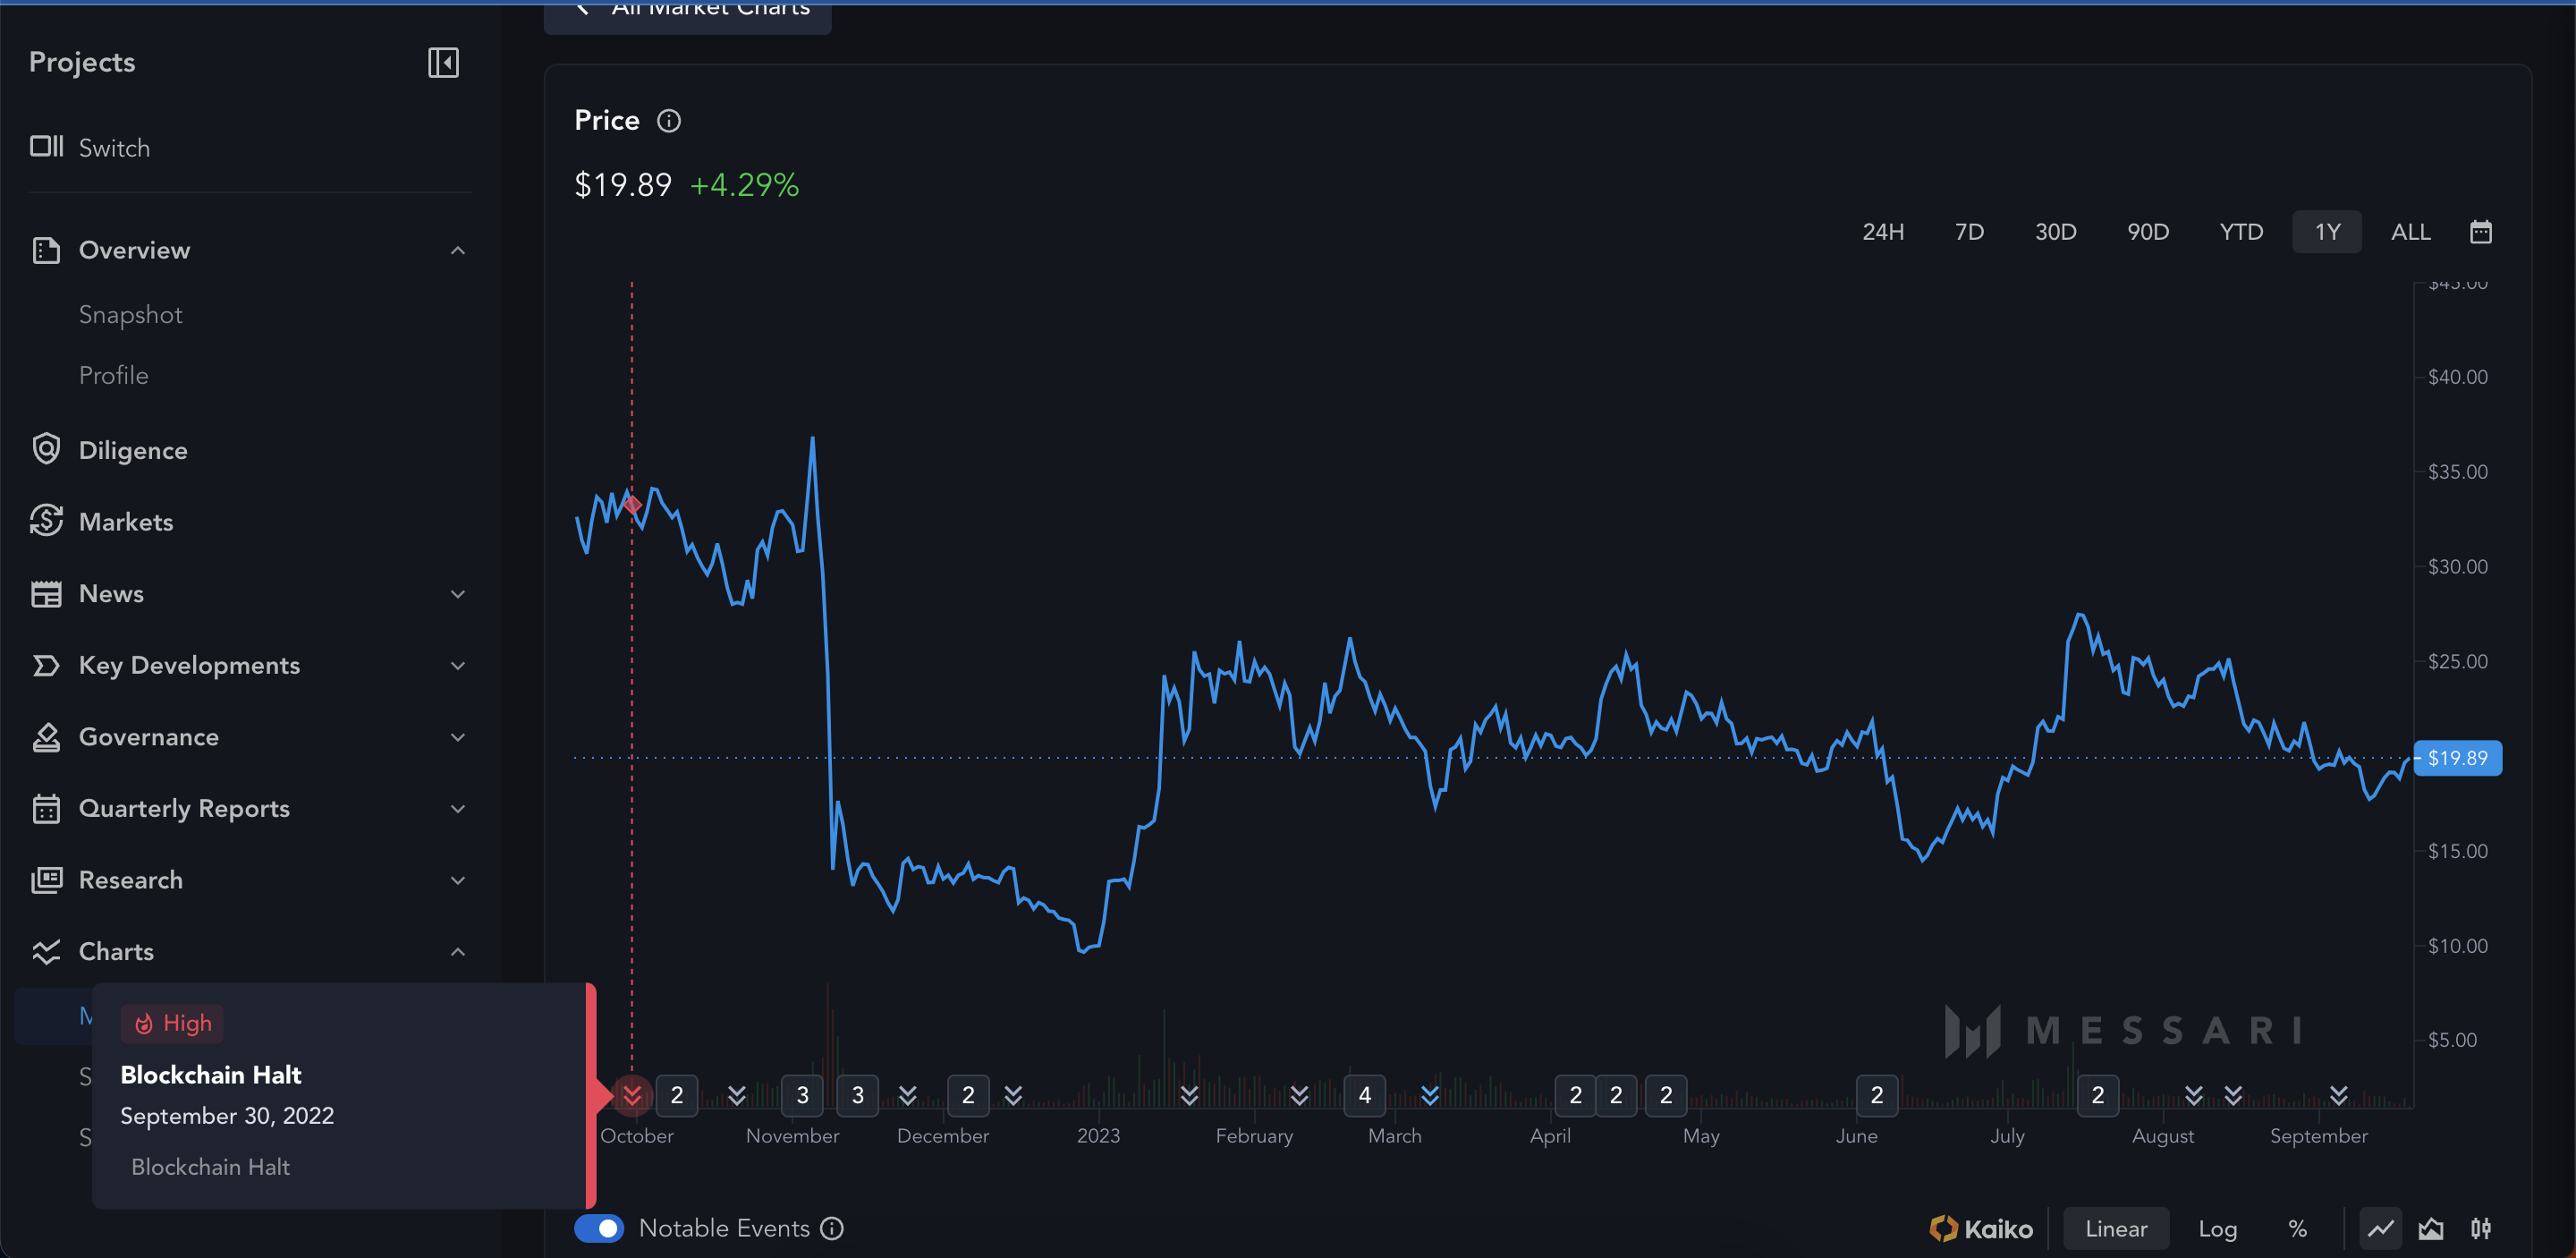
- Overlay Notable Events:
- Users can now overlay high-impact, fundamental events on top of market data charts.
- These notable events are meticulously curated to provide the highest signal to stakeholders and asset researchers, ensuring you're always informed about significant market occurrences.
- Easy Activation:
- Activating chart overlays is now more intuitive than ever. Simply turn on the "Notable events" toggle located at the top right of any price chart, whether you're on the homepage, asset page, or navigating through the Screener tool and Asset section.
- Deep Dive into Event Coverage:
- For those keen on understanding the depth of our event coverage, you can head over to our Intel documentation. This provides a comprehensive view of the events we track and how they can impact your market analysis.
We're dedicated to offering you advanced tools that enhance your market analysis experience. Dive into our detailed guides to explore the full capabilities of these new features. As always, your feedback is invaluable, so please share your insights on how we can further refine our offerings!
- For those keen on understanding the depth of our event coverage, you can head over to our Intel documentation. This provides a comprehensive view of the events we track and how they can impact your market analysis.