> ## Documentation Index
> Fetch the complete documentation index at: https://docs.messari.io/llms.txt
> Use this file to discover all available pages before exploring further.
# Assets
# **Assets Dataset Overview**
Messari's Assets Dataset provides quick and easy access to all of the assets Messari tracks. With filtering and grouping capabilities, custom views, and useful side bar preview panels, you can quickly explore and compare crypto assets.
This page includes a step-by-step guide on getting the most from Messari's **Assets Dataset**.
# **Access Assets**
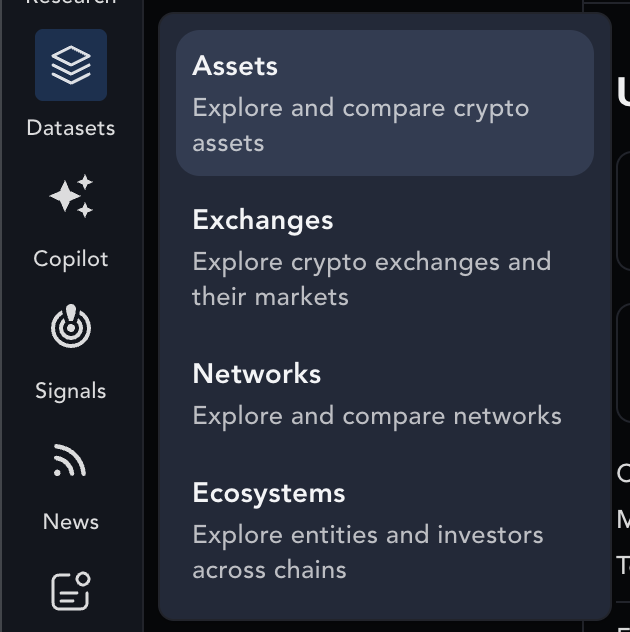
Access the full list of the assets tracked by Messari by navigating to the `Datasets` tab and selecting `Assets`.
 # **Pre-Built Datasets & Views**
## **Datasets**
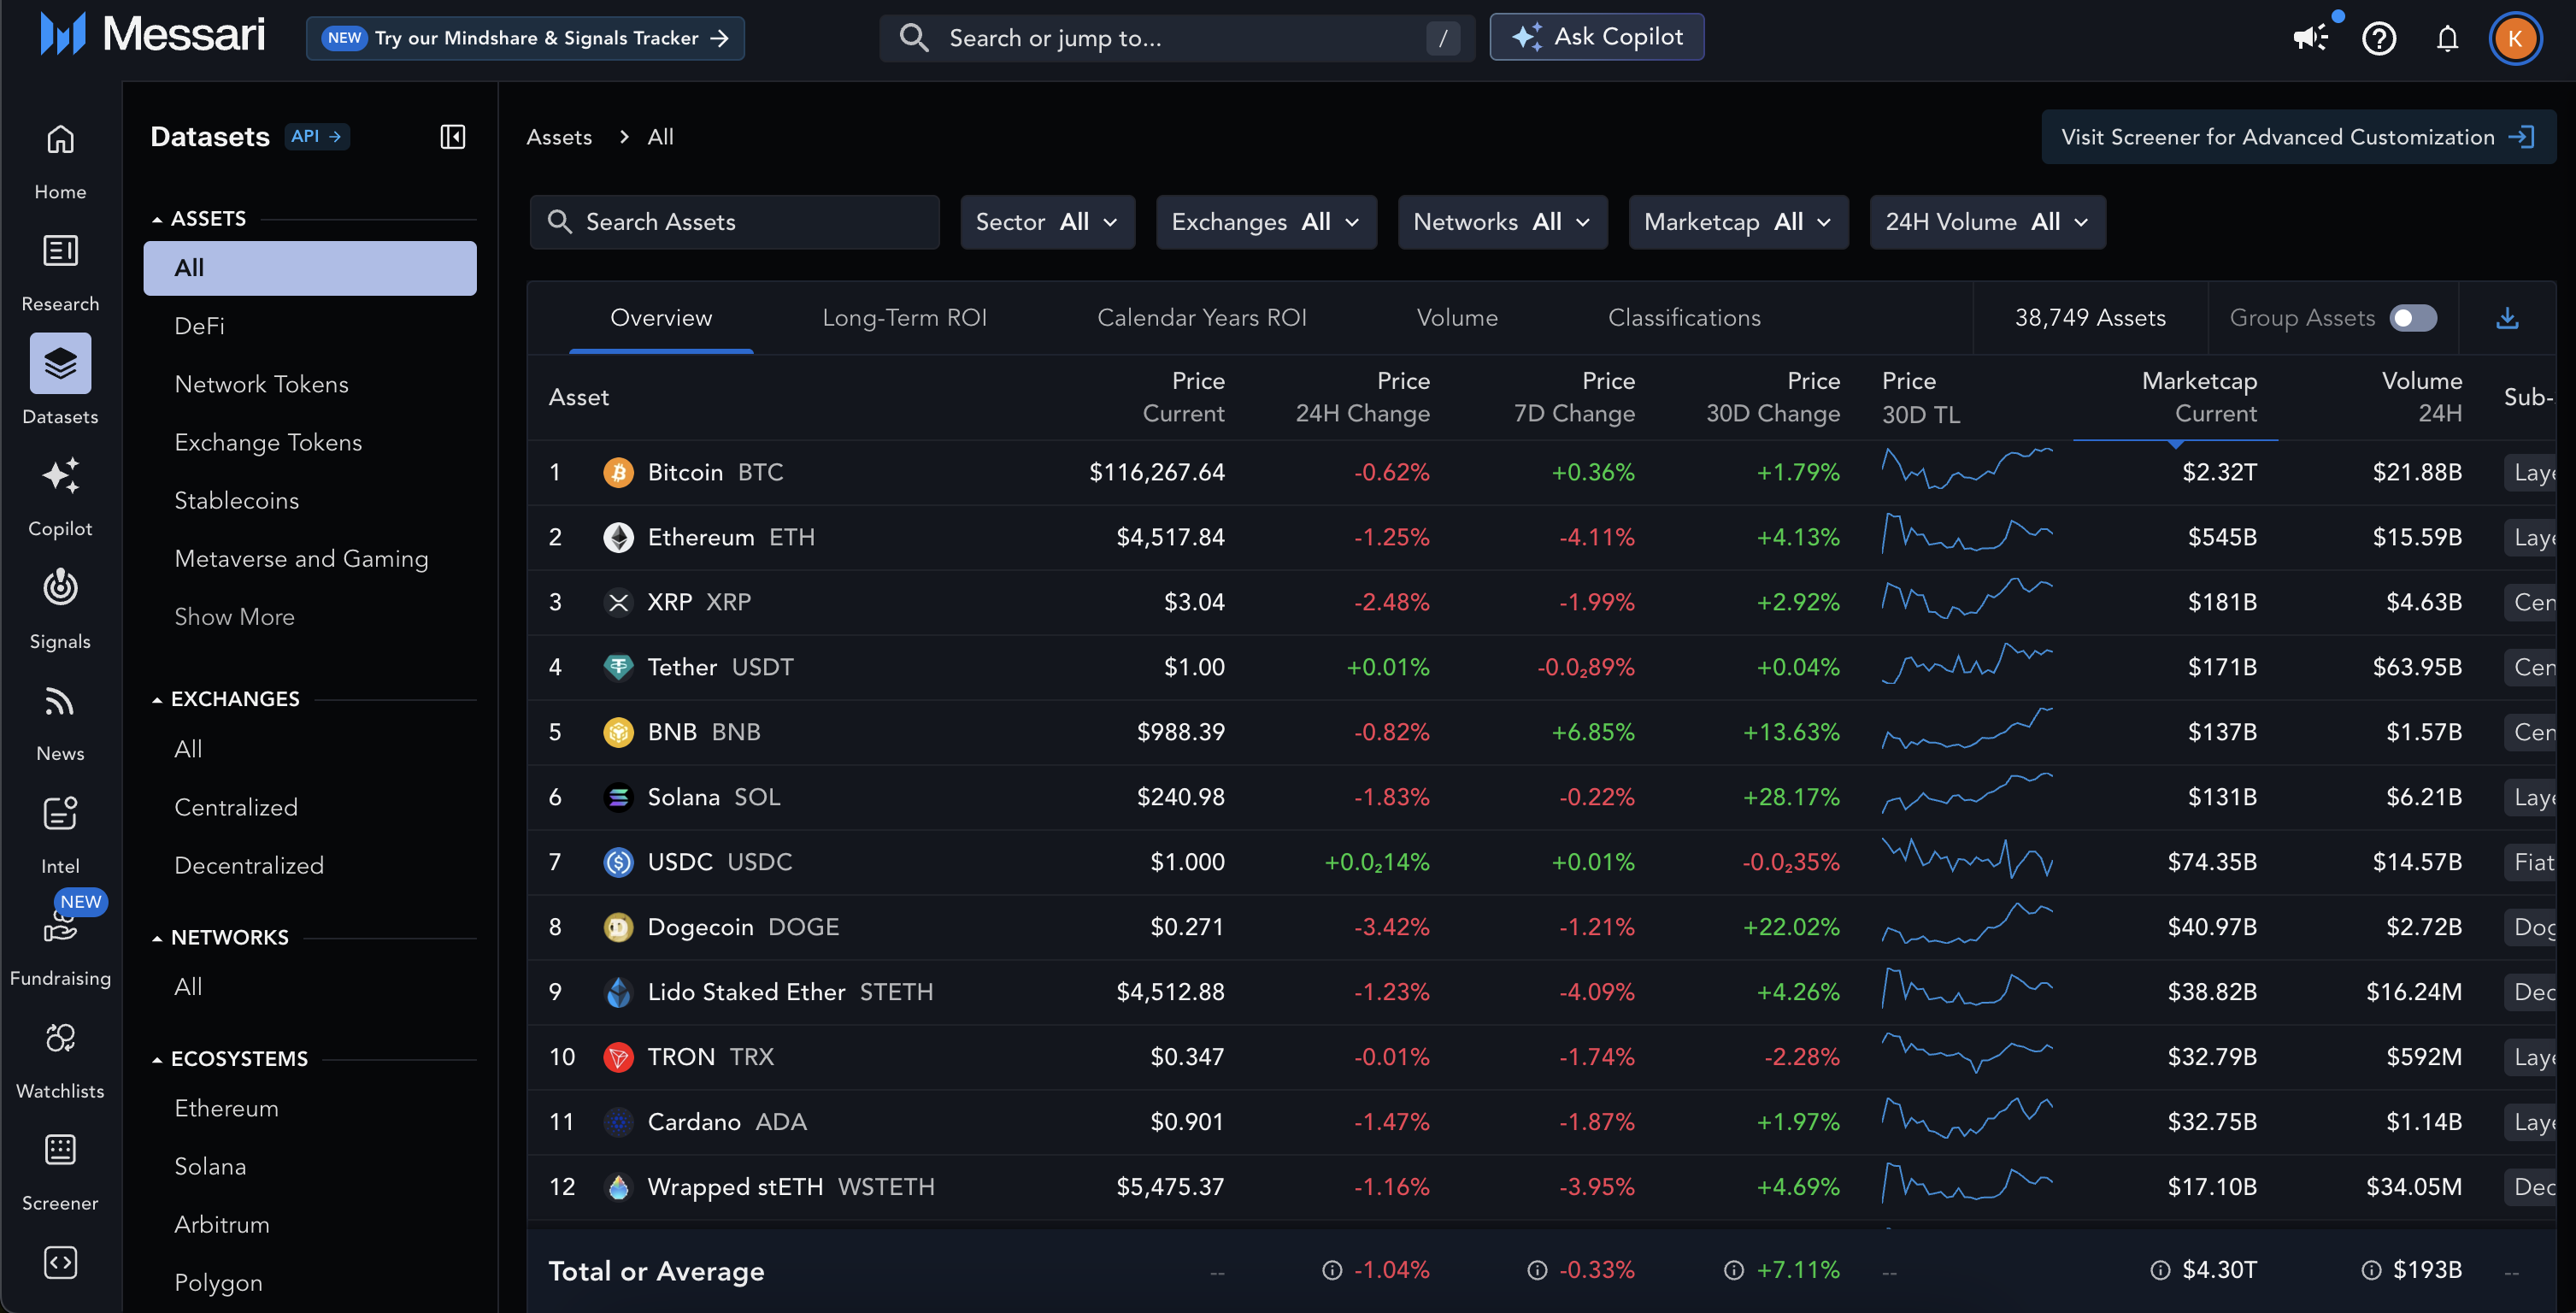
Messari offers pre-built datasets that group assets sharing common themes. You can access these datasets using the left side navigation menu.
By default, the Assets dataset opens with the **All** dataset which includes all tracked assets.
**Additional curated datasets include:** DeFi, Network Tokens, Exchange Tokens, Stablecoins, Currencies, Metaverse and Gaming, Scaling Solutions, Interoperability, Lending Tokens, Privacy Coins, DePin, Governance Tokens, AppChains, Memecoins, Artificial Intelligence, and Derivatives.
# **Pre-Built Datasets & Views**
## **Datasets**
Messari offers pre-built datasets that group assets sharing common themes. You can access these datasets using the left side navigation menu.
By default, the Assets dataset opens with the **All** dataset which includes all tracked assets.
**Additional curated datasets include:** DeFi, Network Tokens, Exchange Tokens, Stablecoins, Currencies, Metaverse and Gaming, Scaling Solutions, Interoperability, Lending Tokens, Privacy Coins, DePin, Governance Tokens, AppChains, Memecoins, Artificial Intelligence, and Derivatives.
 ## **Views**
There are 5 pre-built views to highlight specific information about a dataset.
## **Views**
There are 5 pre-built views to highlight specific information about a dataset.
 These views cannot be customized directly, but they can be re-created using the [Asset Screener](https://docs.messari.io/user-guides/messari-features/asset-screener) tool for advanced filtering and customization.
The **Overview** view, which opens by default, includes metrics such as:
* Price performance over multiple time periods
* 30-day price trendline
* Marketcap
* 24H real volume
* Sector
Other available views:
* **Long-Term ROI**: Metrics such as ATH, price changes over 90 days to 5 years, and % down from ATH.
* **Calendar Years ROI**: Price changes and performance metrics for the last 6 years.
* **Volume**: Information on trading volume, exchanges, and markets.
* **Classifications**: Data on networks, categories, sectors, and tags.
# **Sort & Filter Assets**
Users can sort and filter asset datasets to narrow down their search. The average or total sum for each metric is provided in the last row. Hover over each metric to learn more about it and how it was calculated.
## **Sort**
The Assets dataset is, by default, sorted by Current Marketcap. There are several other sortable columns. Click the column's header to sort by that metric.
## **Filter**
Use the dropdown filters at the top of the dataset to filter by category, sector, tag, exchange, network, marketcap, and/or 24H volume. Narrow your search further by using the search bar to look for specific assets.
# **Group Assets**
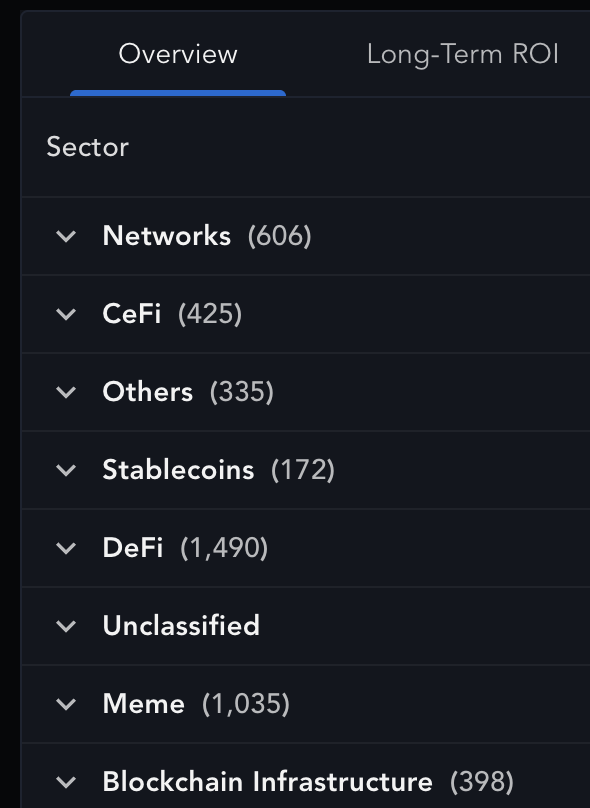
The Grouping feature allows users to easily compare the performance of sectors, networks, and other attributes that Messari has classified through tags to identify different trends across assets. [You can learn more about Messari's Classification System here.](/glossary/classification-system)
Click the `Group` toggle to begin. Group assets by `Category`, `Sector`, `Networks`, or `Tags` and view aggregate quantitative metrics for the resulting groups. Click into each group to view its constituent assets.
**Note:** Previously applied filters will affect the grouping results. Clear filters to include all tracked assets in the group metrics.
These views cannot be customized directly, but they can be re-created using the [Asset Screener](https://docs.messari.io/user-guides/messari-features/asset-screener) tool for advanced filtering and customization.
The **Overview** view, which opens by default, includes metrics such as:
* Price performance over multiple time periods
* 30-day price trendline
* Marketcap
* 24H real volume
* Sector
Other available views:
* **Long-Term ROI**: Metrics such as ATH, price changes over 90 days to 5 years, and % down from ATH.
* **Calendar Years ROI**: Price changes and performance metrics for the last 6 years.
* **Volume**: Information on trading volume, exchanges, and markets.
* **Classifications**: Data on networks, categories, sectors, and tags.
# **Sort & Filter Assets**
Users can sort and filter asset datasets to narrow down their search. The average or total sum for each metric is provided in the last row. Hover over each metric to learn more about it and how it was calculated.
## **Sort**
The Assets dataset is, by default, sorted by Current Marketcap. There are several other sortable columns. Click the column's header to sort by that metric.
## **Filter**
Use the dropdown filters at the top of the dataset to filter by category, sector, tag, exchange, network, marketcap, and/or 24H volume. Narrow your search further by using the search bar to look for specific assets.
# **Group Assets**
The Grouping feature allows users to easily compare the performance of sectors, networks, and other attributes that Messari has classified through tags to identify different trends across assets. [You can learn more about Messari's Classification System here.](/glossary/classification-system)
Click the `Group` toggle to begin. Group assets by `Category`, `Sector`, `Networks`, or `Tags` and view aggregate quantitative metrics for the resulting groups. Click into each group to view its constituent assets.
**Note:** Previously applied filters will affect the grouping results. Clear filters to include all tracked assets in the group metrics.
 Once you've grouped your dataset, change the groupings by clicking the `⌵` icon next to `Grouped by [current group]` in the top right-hand corner. Turn off Groups using the toggle.
 # **Learn More About an Asset**
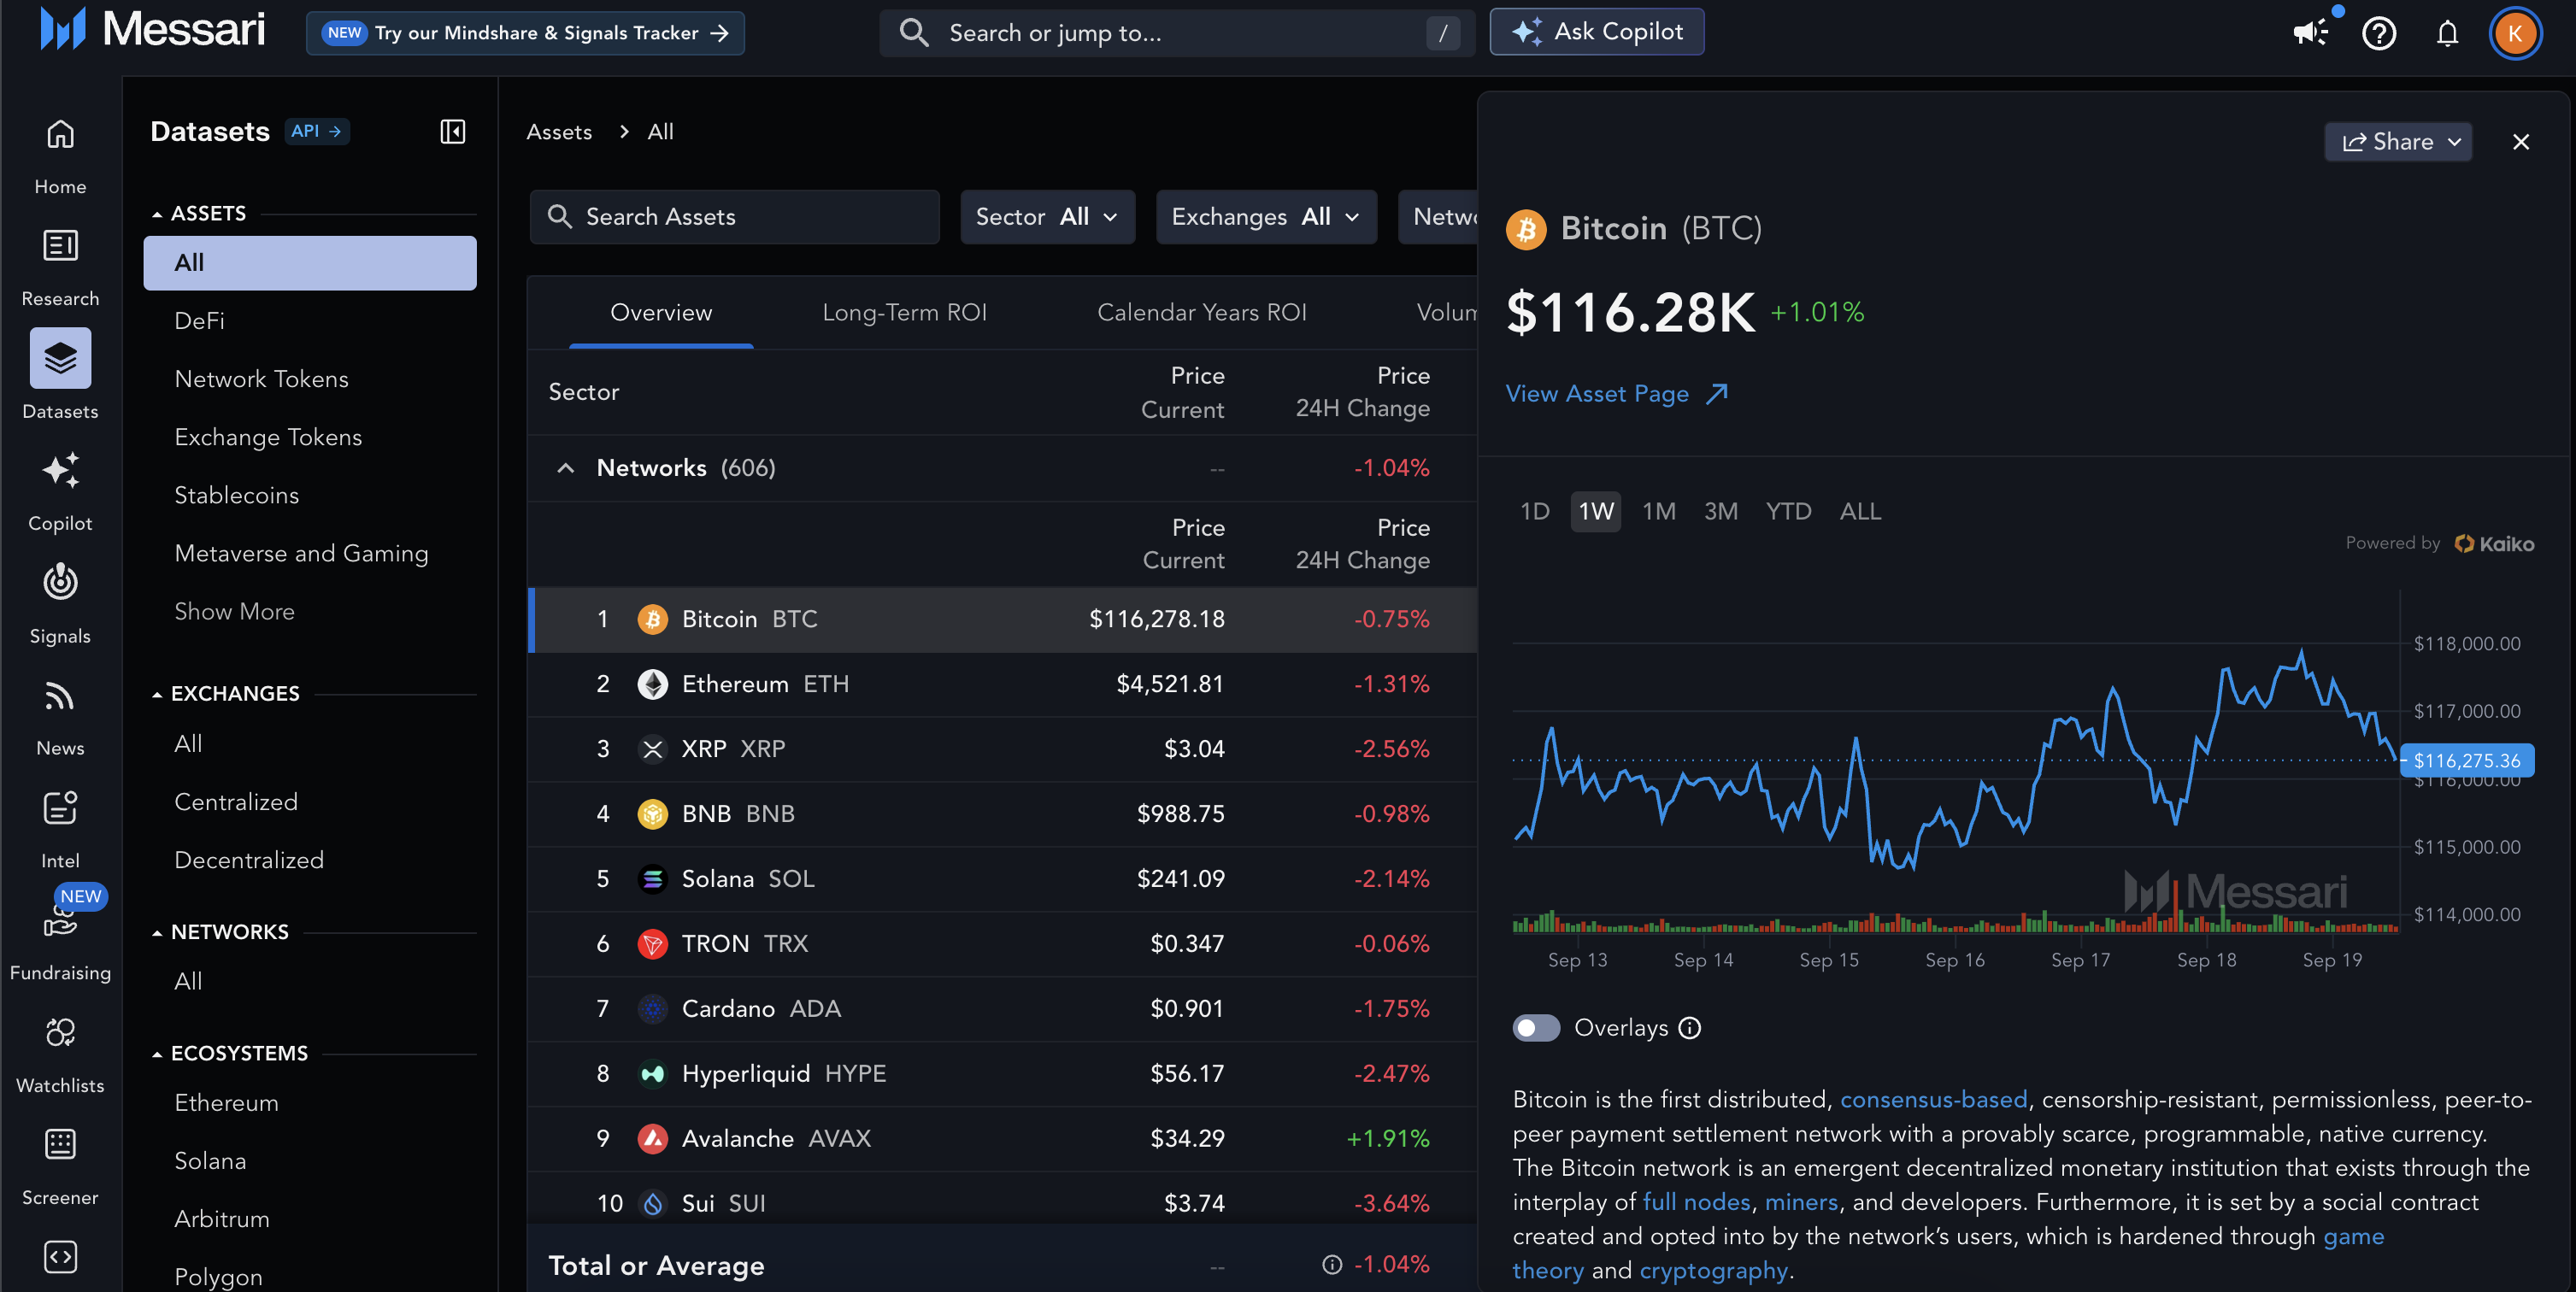
Click on an asset's name to open the side bar preview panel, which contains a price performance chart, project summary, and links to external resources. Scroll through assets using the `^` and `⌵` icons or click `View Asset Page` to open its [Project Page](https://docs.messari.io/user-guides/messari-features/project-page) in an adjacent tab.
Enterprise users can overlay Notable Events to see the price reaction on the price chart. Click on the event link to learn more about it. [Learn more about Notable Events here.](https://docs.messari.io/user-guides/intel/key-developments)
# **Learn More About an Asset**
Click on an asset's name to open the side bar preview panel, which contains a price performance chart, project summary, and links to external resources. Scroll through assets using the `^` and `⌵` icons or click `View Asset Page` to open its [Project Page](https://docs.messari.io/user-guides/messari-features/project-page) in an adjacent tab.
Enterprise users can overlay Notable Events to see the price reaction on the price chart. Click on the event link to learn more about it. [Learn more about Notable Events here.](https://docs.messari.io/user-guides/intel/key-developments)
 # **Share & Download Asset Data**
## **Share**
To share an asset's Project Page, click the `Share` icon in the preview panel.
## **Download**
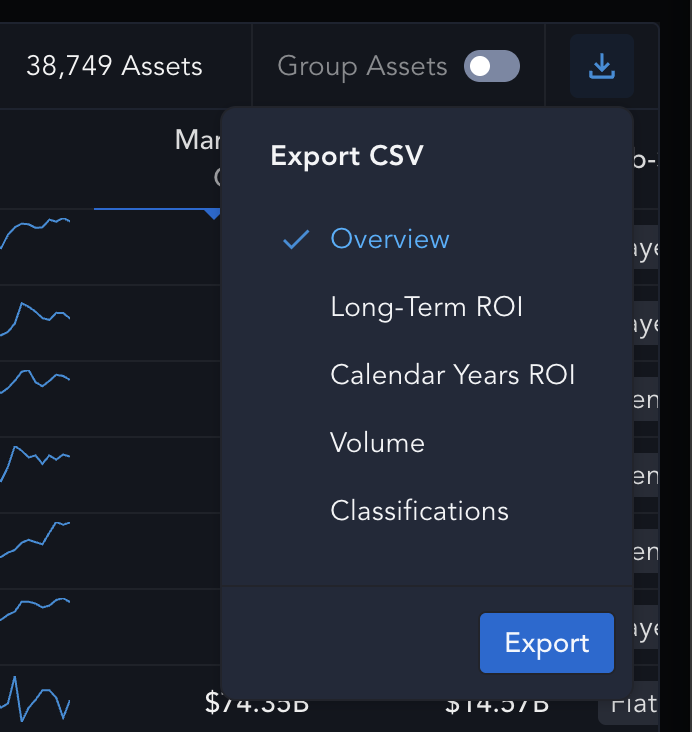
Enterprise users can export datasets by clicking the `Download` icon in the right-hand corner.
* **Export ungrouped data**: Choose a pre-built view to export the dataset.
* **Export grouped data**: Select how you want the data grouped and whether to export aggregate group metrics or data for specific groups and their constituent assets.
# **Share & Download Asset Data**
## **Share**
To share an asset's Project Page, click the `Share` icon in the preview panel.
## **Download**
Enterprise users can export datasets by clicking the `Download` icon in the right-hand corner.
* **Export ungrouped data**: Choose a pre-built view to export the dataset.
* **Export grouped data**: Select how you want the data grouped and whether to export aggregate group metrics or data for specific groups and their constituent assets.
 # **Hot Tips & Best Practices**
* **Grouping filtered results**: Filters applied before grouping will impact the results, so make sure to clear filters for full dataset metrics.
* Utilize the pre-built, curated datasets in the left-side navigation menu for a quick review of assets that share a particular theme.
* The [Asset Screener](https://docs.messari.io/user-guides/messari-features/asset-screener) tool provides the most advanced filtering capabilities.
* Reference the [Messari Classification System](/glossary/classification-system) to better understand how assets are categorized.
* Keyboard Shortcuts in preview panel:
* Previous asset `K`
* Next asset `J`
* Close preview panel `Esc`
***
# **Datasets FAQs**
### **Can I save the filters and groups I've applied to an Asset dataset?**
You cannot save customizations made to an Asset dataset. Use the [Asset Screener tool](https://docs.messari.io/user-guides/messari-features/asset-screener) to create and save custom filters and views.
### **How can I compare Network data across chains?**
The [Networks Dataset](https://docs.messari.io/user-guides/datasets/networks) allows you to compare key metrics across supported networks in either the table or chart format and over various timespans. With the Network dataset, you can analyze performance differences and identify trends across the blockchain ecosystem.
### **Which exchanges does Messari track?**
To view the full list of centralized (CEXes) and decentralized exchanges (DEXes) that Messari tracks, navigate to the `Datasets` tab in the top menu and select `Exchanges`. Learn more about Messari's Exchanges Dataset [here](https://docs.messari.io/user-guides/datasets/exchanges).
### **How up-to-date is the trading activity that Messari tracks?**
Messari aims to provide users with accurate and up-to-date trading data. On an exchange's [Exchange page](https://docs.messari.io/user-guides/datasets/exchanges) or All Markets page, users can quickly determine whether a unique asset pair's data is live, stale, or inactive thanks to the `Liveness` icon adjacent to the pair's name. Trading data can be either live, stale or inactive:
* **Live:** Messari has received trades from this market within the last 10 minutes
* **Stale:** Messari has not received a trade from this market over the last 10 minutes, but it has traded over the last 24 hours
* **Inactive:** Messari has not received a trade from this market in over 24 hours
### **How can I learn more about Messari's taxonomy and methodology?**
Please visit the [Messari Classification System](/glossary/classification-system) page for mapping across Categories, Sectors, and Tags. For Fundraising-specific mapping, such as Type and Stage, please visit the [Fundraising Data Methodology](/glossary/fundraising-taxonomy) page. Market Data methodology and definitions can be found [here](/glossary/data-metrics/asset-metrics-definitions).
# **Hot Tips & Best Practices**
* **Grouping filtered results**: Filters applied before grouping will impact the results, so make sure to clear filters for full dataset metrics.
* Utilize the pre-built, curated datasets in the left-side navigation menu for a quick review of assets that share a particular theme.
* The [Asset Screener](https://docs.messari.io/user-guides/messari-features/asset-screener) tool provides the most advanced filtering capabilities.
* Reference the [Messari Classification System](/glossary/classification-system) to better understand how assets are categorized.
* Keyboard Shortcuts in preview panel:
* Previous asset `K`
* Next asset `J`
* Close preview panel `Esc`
***
# **Datasets FAQs**
### **Can I save the filters and groups I've applied to an Asset dataset?**
You cannot save customizations made to an Asset dataset. Use the [Asset Screener tool](https://docs.messari.io/user-guides/messari-features/asset-screener) to create and save custom filters and views.
### **How can I compare Network data across chains?**
The [Networks Dataset](https://docs.messari.io/user-guides/datasets/networks) allows you to compare key metrics across supported networks in either the table or chart format and over various timespans. With the Network dataset, you can analyze performance differences and identify trends across the blockchain ecosystem.
### **Which exchanges does Messari track?**
To view the full list of centralized (CEXes) and decentralized exchanges (DEXes) that Messari tracks, navigate to the `Datasets` tab in the top menu and select `Exchanges`. Learn more about Messari's Exchanges Dataset [here](https://docs.messari.io/user-guides/datasets/exchanges).
### **How up-to-date is the trading activity that Messari tracks?**
Messari aims to provide users with accurate and up-to-date trading data. On an exchange's [Exchange page](https://docs.messari.io/user-guides/datasets/exchanges) or All Markets page, users can quickly determine whether a unique asset pair's data is live, stale, or inactive thanks to the `Liveness` icon adjacent to the pair's name. Trading data can be either live, stale or inactive:
* **Live:** Messari has received trades from this market within the last 10 minutes
* **Stale:** Messari has not received a trade from this market over the last 10 minutes, but it has traded over the last 24 hours
* **Inactive:** Messari has not received a trade from this market in over 24 hours
### **How can I learn more about Messari's taxonomy and methodology?**
Please visit the [Messari Classification System](/glossary/classification-system) page for mapping across Categories, Sectors, and Tags. For Fundraising-specific mapping, such as Type and Stage, please visit the [Fundraising Data Methodology](/glossary/fundraising-taxonomy) page. Market Data methodology and definitions can be found [here](/glossary/data-metrics/asset-metrics-definitions).