> ## Documentation Index
> Fetch the complete documentation index at: https://docs.messari.io/llms.txt
> Use this file to discover all available pages before exploring further.
# Ecosystems
# **Ecosystems Dataset Overview**
Use Messari's Ecosystems Dataset to explore entities, assets, and investors across chains. With pre-built views, custom filtering, and useful preview panels, users can deep-dive into a network's projects and investors to learn more about what's being built and who's funding what.
This page includes a step-by-step guide on getting the most from Messari's **Ecosystems Dataset**.
# **Access Ecosystems**
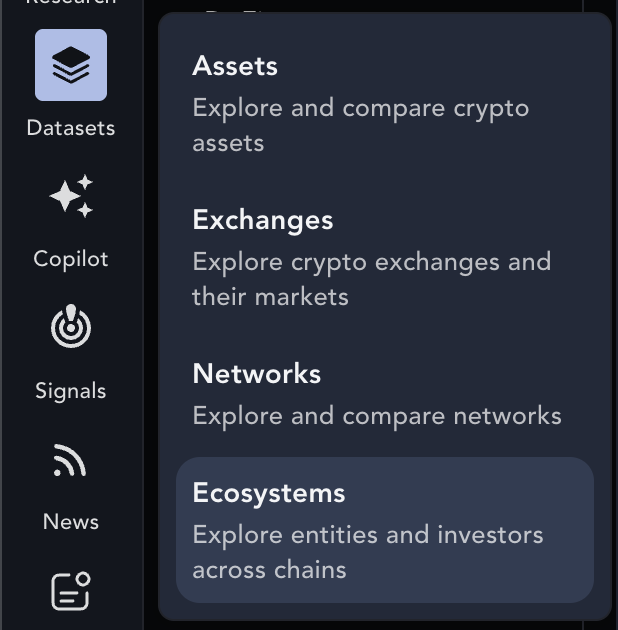
Access the Ecosystems Dataset by going to the `Datasets` tab and selecting `Ecosystems`.
 # **Datasets & Views**
## **Choose an Ecosystem**
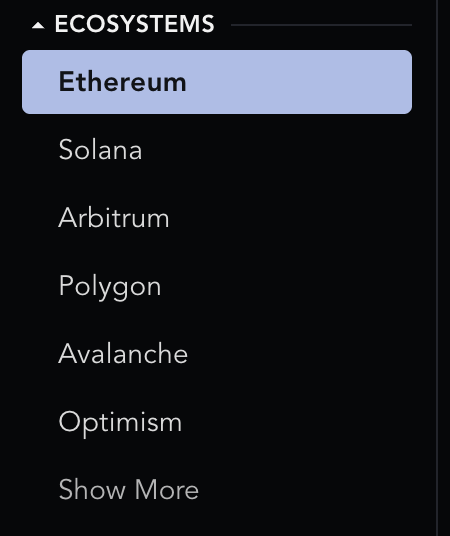
The Ecosystems Dataset is categorized by network and opens, by default, in the Ethereum Ecosystem. Additional networks are located in the left-side navigation menu.
# **Datasets & Views**
## **Choose an Ecosystem**
The Ecosystems Dataset is categorized by network and opens, by default, in the Ethereum Ecosystem. Additional networks are located in the left-side navigation menu.
 ## **Choose a Dataset**
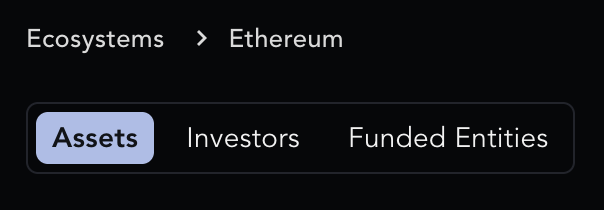
Each ecosystem features 3 datasets that cover:
* Assets
* Investors
* Funded Entities
Each dataset covers a variety of related metrics. Learn more about Messari's [Fundraising Methodology](/glossary/fundraising-taxonomy) and [Classification System](/glossary/classification-system) here.
## **Choose a Dataset**
Each ecosystem features 3 datasets that cover:
* Assets
* Investors
* Funded Entities
Each dataset covers a variety of related metrics. Learn more about Messari's [Fundraising Methodology](/glossary/fundraising-taxonomy) and [Classification System](/glossary/classification-system) here.
 ### **Assets**
Each ecosystem's Assets dataset includes 5 pre-built views that highlight specific information.
These views cannot be customized directly, but you can re-create them using the [Asset Screener](https://docs.messari.io/user-guides/messari-features/asset-screener) tool for more flexibility.
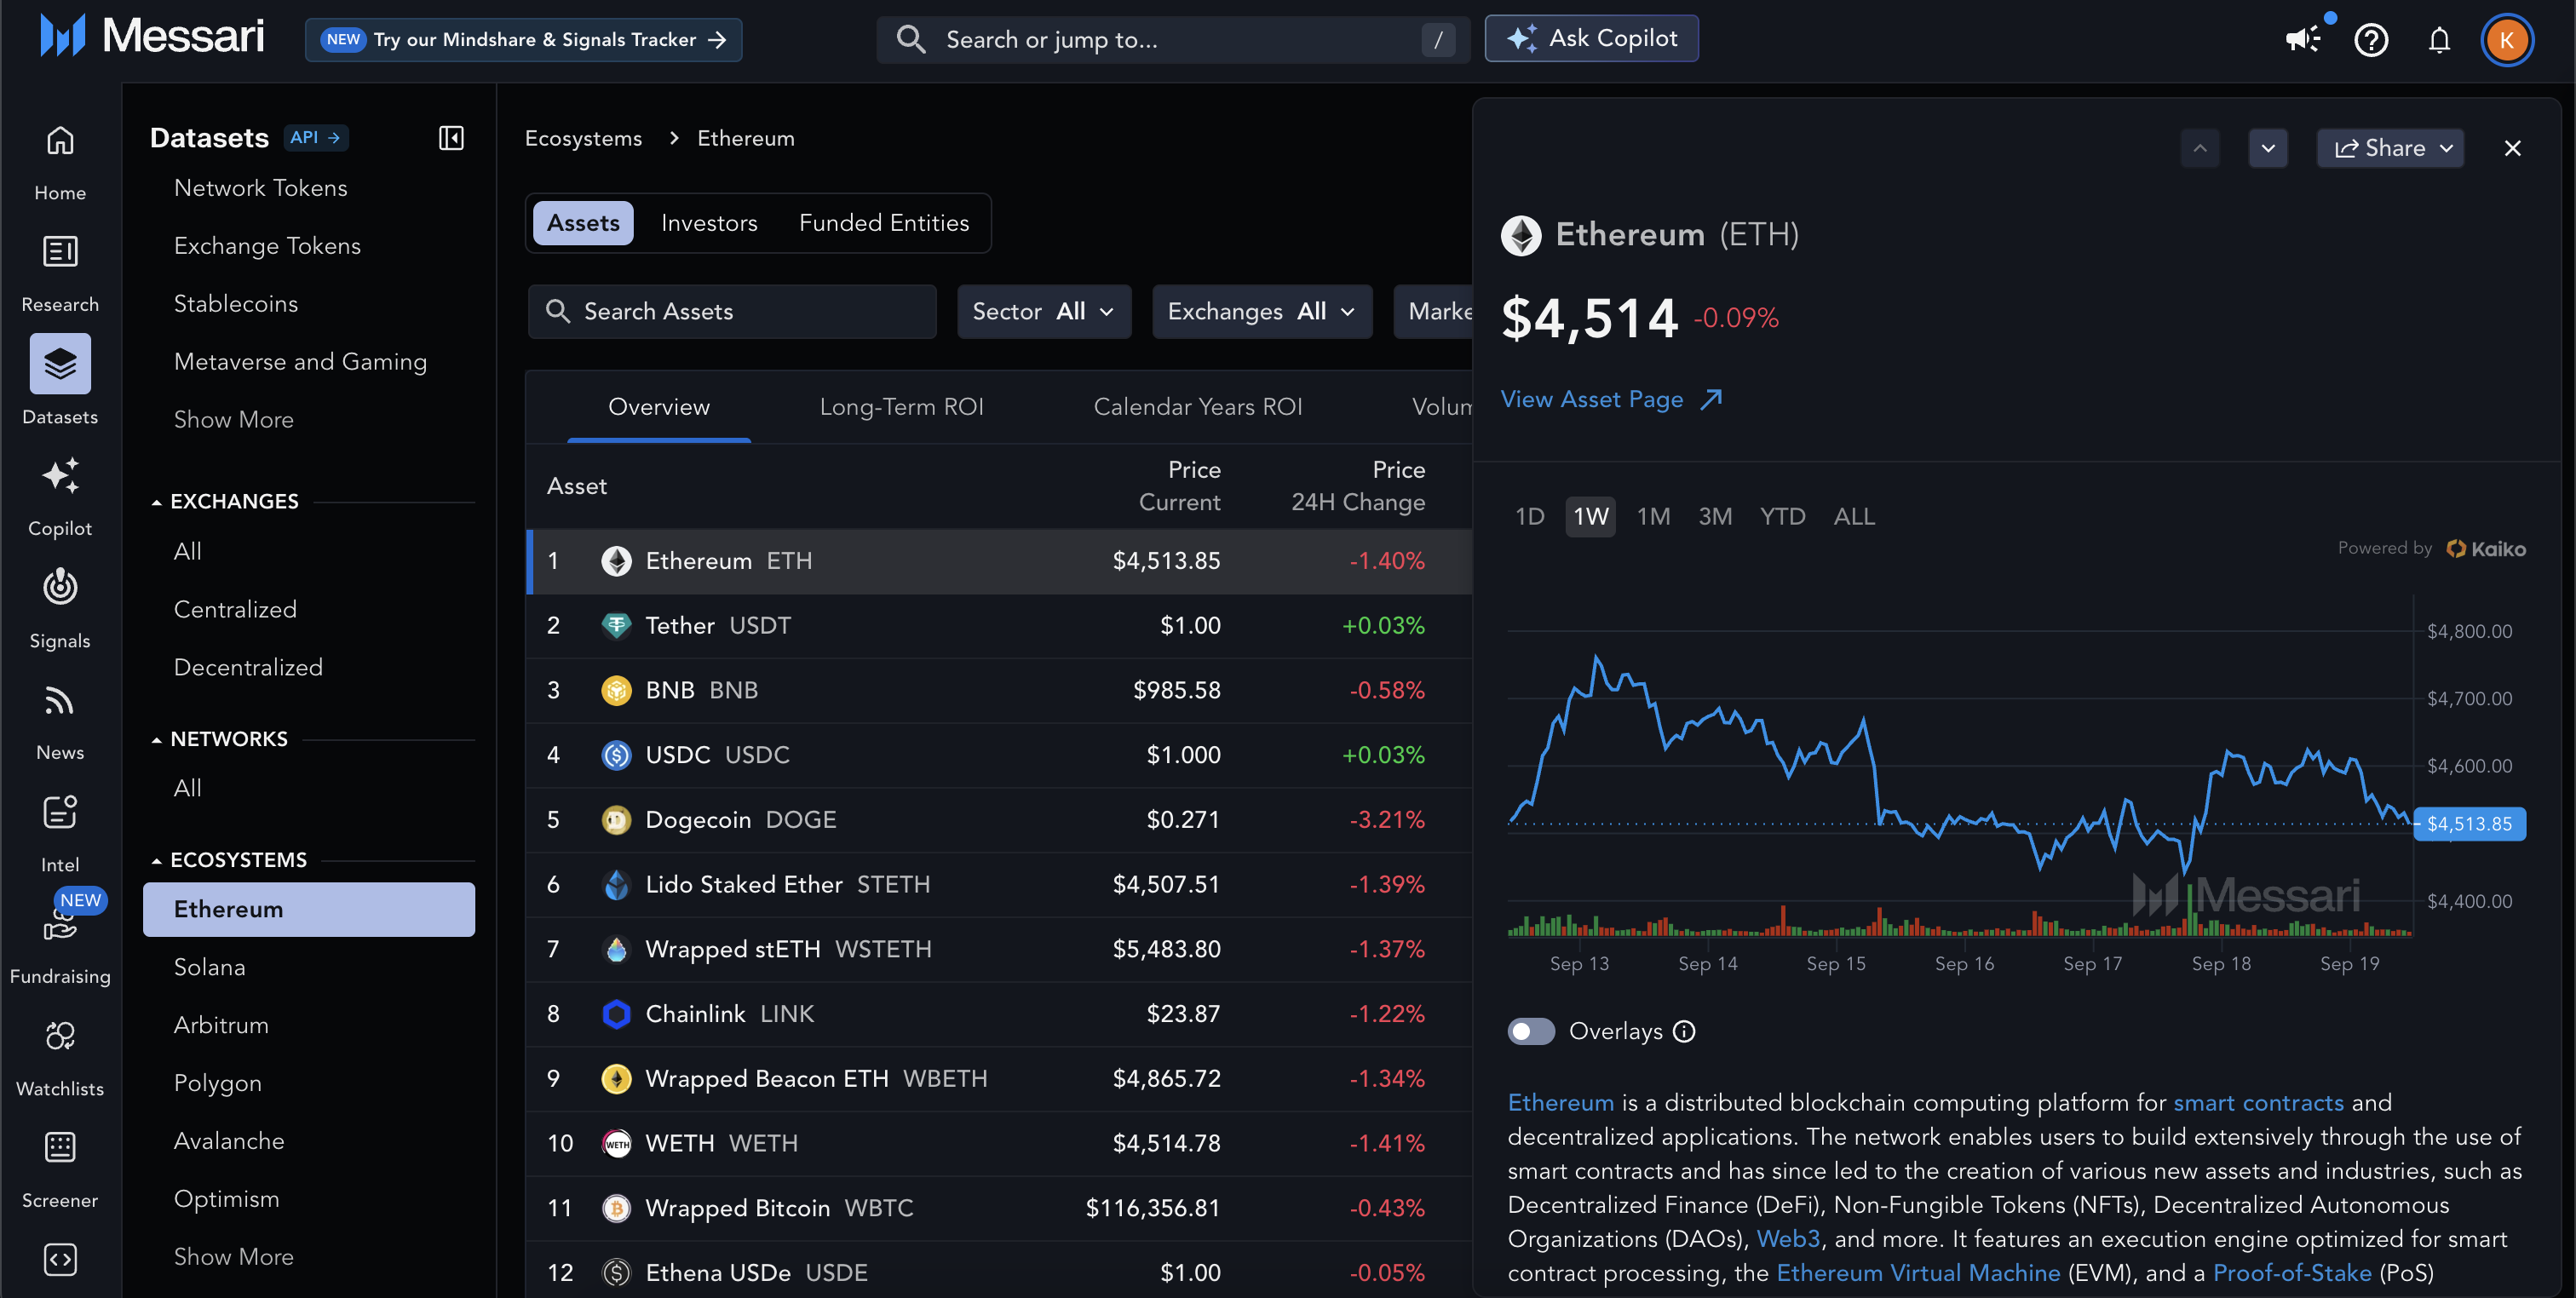
The Assets dataset opens in the **Overview** view by default, which contains metrics such as:
* Price performance over multiple time periods
* 30D price trendline
* Marketcap
* 24H real volume
* Sector
### **Assets**
Each ecosystem's Assets dataset includes 5 pre-built views that highlight specific information.
These views cannot be customized directly, but you can re-create them using the [Asset Screener](https://docs.messari.io/user-guides/messari-features/asset-screener) tool for more flexibility.
The Assets dataset opens in the **Overview** view by default, which contains metrics such as:
* Price performance over multiple time periods
* 30D price trendline
* Marketcap
* 24H real volume
* Sector
 Additional views:
* **Long-Term ROI**: Metrics like current price, ATH, % down from ATH, 90D price change, 180D price change, 1Y price change, 3Y price change, and 5Y price change.
* **Calendar Years ROI**: Current price, current marketcap, YTD price change, and price change metrics for each of the previous 6 years.
* **Volume**: Current marketcap, exchanges traded (the exchanges the asset is traded on based on the exchanges Messari tracks data from), 24H real volume, 7D real volume, 30D real volume, YTD real volume, YTD trendline for real volume, and markets (the number of markets the asset is traded in).
* **Classifications**: Current price, current marketcap, exchanges traded, asset networks, category, sector, and tags.
### **Investors**
The Investors dataset contains data on investors in a Network and its associated projects. Metrics include:
* Investor Name
* Investment Count
* Co-investors
* Most Common Investment Type
* Most Common Investment Sector
* Median Round Amount
* Last Investment and Last Investment Date
* First Investment and First Investment Date,
* LPs
### **Funded Entities**
The Funded Entities dataset provides information on network entities that have received funding. Metrics include:
* Funded Entity
* Total Amount Raised
* Latest Round Type and Date
* Investors
* Category
* Sector
* Tags
# **Sort & Filter Data**
## **Sort**
You can sort assets, investors, and funded entities by clicking column headers. By default, the datasets are sorted as follows:
* **Assets**: Current Marketcap
* **Investors**: Investment Count
* **Funded Entities**: Total Amount Raised
## **Filter**
Each dataset can be filtered using dropdown filters at the top of the page. You can narrow your results further by using the search bar to look for specific assets, investors, or entities.
* **Assets** filters: Category, Sector, Tag, Exchange, Marketcap, 24H Volume.
* **Investors** filters: Type, Country, Most Common Investment Type.
* **Funded Entities** filters: Category, Sector, Tag, Round Type.
# **Learn More About an Asset, Investor, or Funded Entity**
Click on an asset, investor, or funded entity in the dataset to open its preview panel.
Use the `^` `⌵` icons to scroll through assets, investors, or entities without having to close the preview panel, or click on `View Asset Page` or `View Fundraising Page` to open its associated [Project page](https://docs.messari.io/user-guides/messari-features/project-page) or [Fundraising page](https://docs.messari.io/user-guides/fundraising/funding-rounds) in an adjacent tab.
## **Assets**
An asset's preview panel includes links to its asset project page, and also includes a TradingView chart integration, a brief project summary, and links to external resources.
Enterprise users can overlay Key Developments to see the price reaction on the price chart. Click on the event link to learn more about it. Learn more about Notable Events [here.](https://docs.messari.io/user-guides/intel/key-developments)
## **Investors**
The investor preview panel provides a brief description, as well as data on publicly available information such as Investment Count, Most Common Stage, and Median Round Amount. Scroll down to view recent closed rounds, and use the links at the top for access to the investor's website and socials.
## **Entities**
The preview panel for funded entities displays a brief description and information such as Latest Round, Total Amount Raised, Sector, and Industry. Scroll down to see recent closed rounds, and use the links at the top for access to the entity's website and socials.
# **Share & Download Ecosystem Data**
## **Share**
In the preview panel for assets, you can share a link to the asset's Project Page by clicking the `Share` icon in the right-hand corner.
## **Download**
Enterprise users can export datasets for assets, investors, and/or funded entities by clicking the `Download` icon in the right-hand corner.
# **Hot Tips & Best Practices**
* Messari's Screener tool offers the most advanced filtering capabilities. Use it to create custom filters by network, then set up customized columns and views for further exploration. Check out Messari's [Asset Screener](https://docs.messari.io/user-guides/messari-features/asset-screener) and [Fundraising Screener](https://messari.io/screener/funding-round) to learn more.
* Reference the [Messari Classification System](/glossary/classification-system) to better understand how categories, sectors, and tags are classified.
* Keyboard Shortcuts in preview panel:
* Previous asset/investor/entity `K`
* Next asset/investor/entity `J`
* Close preview panel `Esc`
Additional views:
* **Long-Term ROI**: Metrics like current price, ATH, % down from ATH, 90D price change, 180D price change, 1Y price change, 3Y price change, and 5Y price change.
* **Calendar Years ROI**: Current price, current marketcap, YTD price change, and price change metrics for each of the previous 6 years.
* **Volume**: Current marketcap, exchanges traded (the exchanges the asset is traded on based on the exchanges Messari tracks data from), 24H real volume, 7D real volume, 30D real volume, YTD real volume, YTD trendline for real volume, and markets (the number of markets the asset is traded in).
* **Classifications**: Current price, current marketcap, exchanges traded, asset networks, category, sector, and tags.
### **Investors**
The Investors dataset contains data on investors in a Network and its associated projects. Metrics include:
* Investor Name
* Investment Count
* Co-investors
* Most Common Investment Type
* Most Common Investment Sector
* Median Round Amount
* Last Investment and Last Investment Date
* First Investment and First Investment Date,
* LPs
### **Funded Entities**
The Funded Entities dataset provides information on network entities that have received funding. Metrics include:
* Funded Entity
* Total Amount Raised
* Latest Round Type and Date
* Investors
* Category
* Sector
* Tags
# **Sort & Filter Data**
## **Sort**
You can sort assets, investors, and funded entities by clicking column headers. By default, the datasets are sorted as follows:
* **Assets**: Current Marketcap
* **Investors**: Investment Count
* **Funded Entities**: Total Amount Raised
## **Filter**
Each dataset can be filtered using dropdown filters at the top of the page. You can narrow your results further by using the search bar to look for specific assets, investors, or entities.
* **Assets** filters: Category, Sector, Tag, Exchange, Marketcap, 24H Volume.
* **Investors** filters: Type, Country, Most Common Investment Type.
* **Funded Entities** filters: Category, Sector, Tag, Round Type.
# **Learn More About an Asset, Investor, or Funded Entity**
Click on an asset, investor, or funded entity in the dataset to open its preview panel.
Use the `^` `⌵` icons to scroll through assets, investors, or entities without having to close the preview panel, or click on `View Asset Page` or `View Fundraising Page` to open its associated [Project page](https://docs.messari.io/user-guides/messari-features/project-page) or [Fundraising page](https://docs.messari.io/user-guides/fundraising/funding-rounds) in an adjacent tab.
## **Assets**
An asset's preview panel includes links to its asset project page, and also includes a TradingView chart integration, a brief project summary, and links to external resources.
Enterprise users can overlay Key Developments to see the price reaction on the price chart. Click on the event link to learn more about it. Learn more about Notable Events [here.](https://docs.messari.io/user-guides/intel/key-developments)
## **Investors**
The investor preview panel provides a brief description, as well as data on publicly available information such as Investment Count, Most Common Stage, and Median Round Amount. Scroll down to view recent closed rounds, and use the links at the top for access to the investor's website and socials.
## **Entities**
The preview panel for funded entities displays a brief description and information such as Latest Round, Total Amount Raised, Sector, and Industry. Scroll down to see recent closed rounds, and use the links at the top for access to the entity's website and socials.
# **Share & Download Ecosystem Data**
## **Share**
In the preview panel for assets, you can share a link to the asset's Project Page by clicking the `Share` icon in the right-hand corner.
## **Download**
Enterprise users can export datasets for assets, investors, and/or funded entities by clicking the `Download` icon in the right-hand corner.
# **Hot Tips & Best Practices**
* Messari's Screener tool offers the most advanced filtering capabilities. Use it to create custom filters by network, then set up customized columns and views for further exploration. Check out Messari's [Asset Screener](https://docs.messari.io/user-guides/messari-features/asset-screener) and [Fundraising Screener](https://messari.io/screener/funding-round) to learn more.
* Reference the [Messari Classification System](/glossary/classification-system) to better understand how categories, sectors, and tags are classified.
* Keyboard Shortcuts in preview panel:
* Previous asset/investor/entity `K`
* Next asset/investor/entity `J`
* Close preview panel `Esc`