> ## Documentation Index
> Fetch the complete documentation index at: https://docs.messari.io/llms.txt
> Use this file to discover all available pages before exploring further.
# Networks
# **Networks Dataset Overview**
The Networks Dataset allows users to explore metrics for all of the top networks. Quickly browse metrics in tables, visualize trends in charts, and deep-dive into an individual network to learn more about its on-chain usage, activity, and growth.
This page includes a step-by-step guide on getting the most from Messari's **Networks Dataset**.
# **Access Networks**
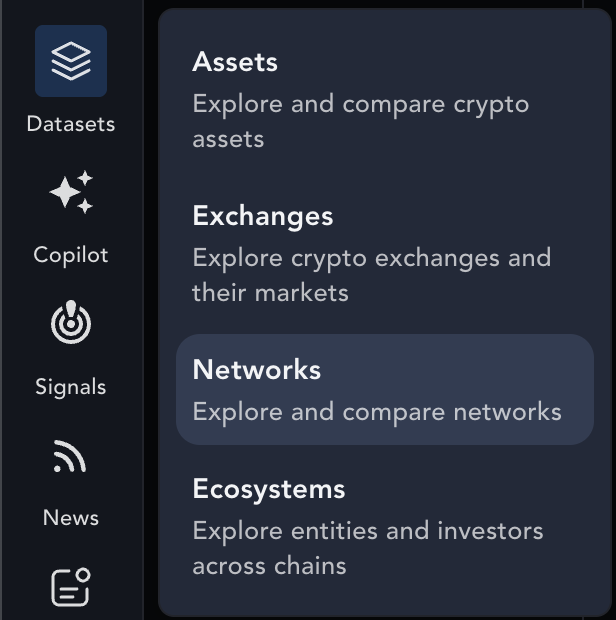
To view the full list of the networks Messari tracks data from, go to the `Datasets` tab and select `Networks`.
You can also access specific network data directly from the [Project Page](https://docs.messari.io/user-guides/messari-features/project-page) by clicking on `Network Fundamentals` and `Statements` in the left-side navigation menu.
 # **Pre-Built Views**
## **Tables & Charts**
Messari's Networks Dataset can be viewed in a tabulated (table) or chart format.
### **Table Format**
The Networks dataset opens, by default, in the Table format with the pre-built **Key Metrics** view, which includes metrics on such as:
* Transactions and transaction fees
* Average daily active addresses
* Circulating marketcap
# **Pre-Built Views**
## **Tables & Charts**
Messari's Networks Dataset can be viewed in a tabulated (table) or chart format.
### **Table Format**
The Networks dataset opens, by default, in the Table format with the pre-built **Key Metrics** view, which includes metrics on such as:
* Transactions and transaction fees
* Average daily active addresses
* Circulating marketcap
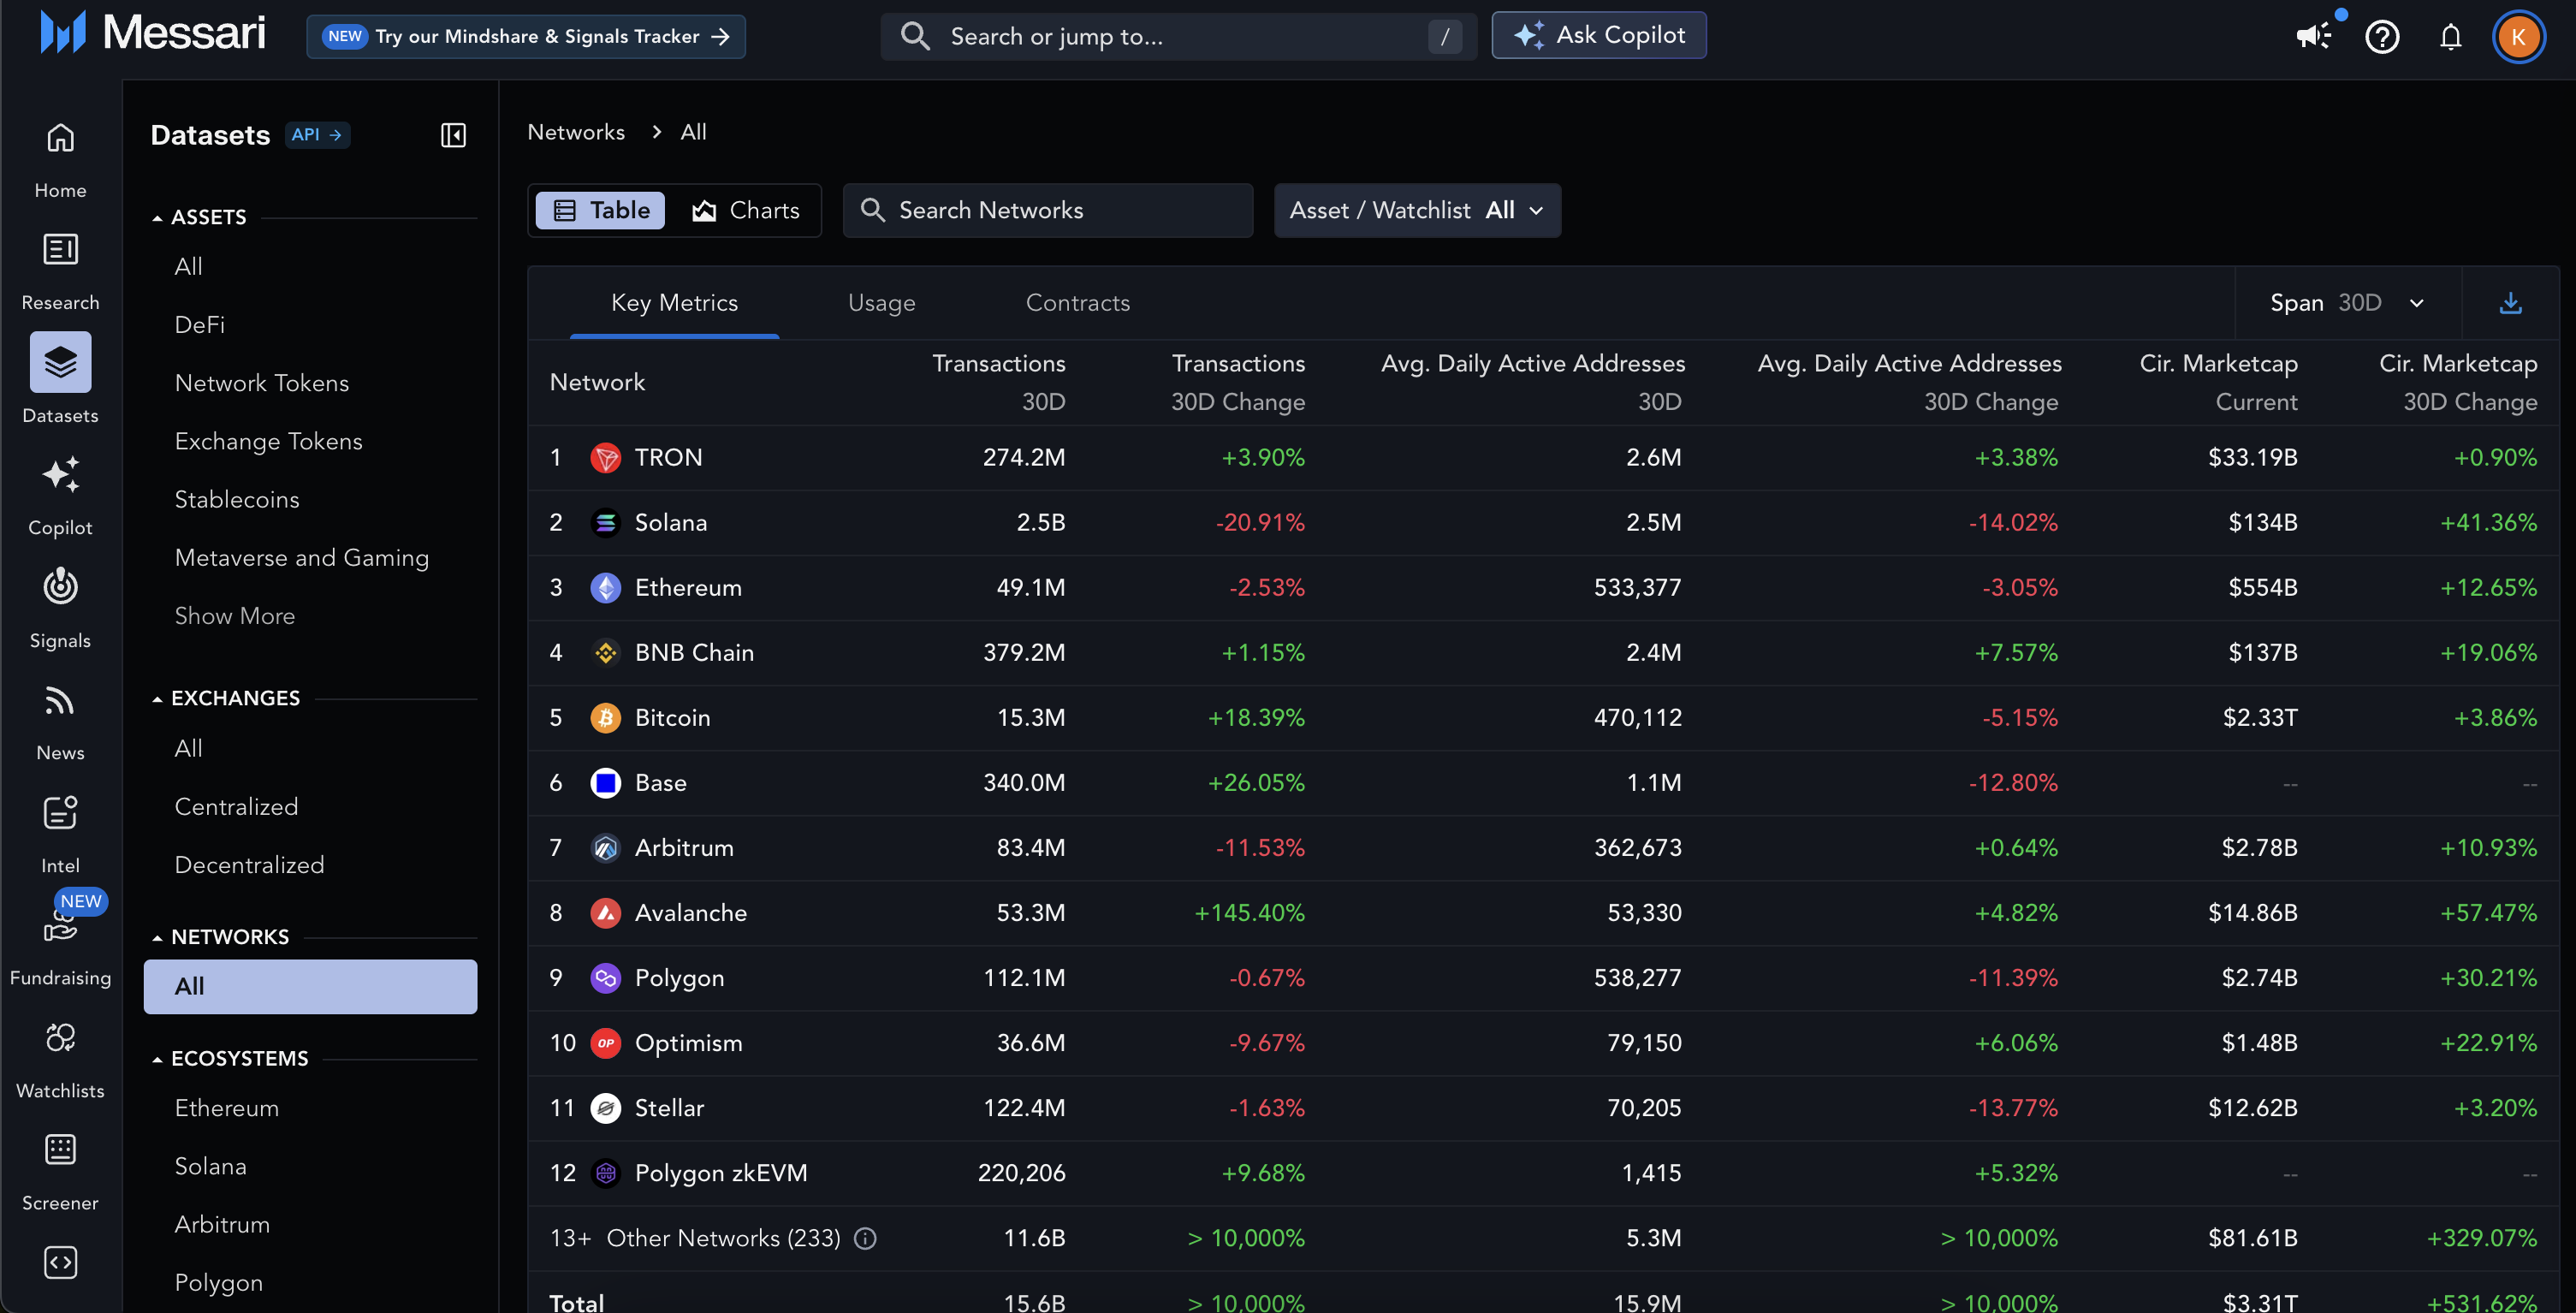 Additional views include:
* **Usage**: transactions and transaction fees, average daily active addresses, average daily new addresses, and average daily returning addresses
* **Contracts**: total contract calls, new contracts deployed, average daily active contracts, average daily new contracts called, average daily returning contracts called, and average daily unique contract callers
At the bottom of each table is a **Total** column which provides the total of each column's metric across all tracked networks.
Note that **Other Networks** is an aggregated group of networks which Messari doesn't yet fully support. Hover over this group's associated tooltip icon to see which networks are included.
### **Chart Format**
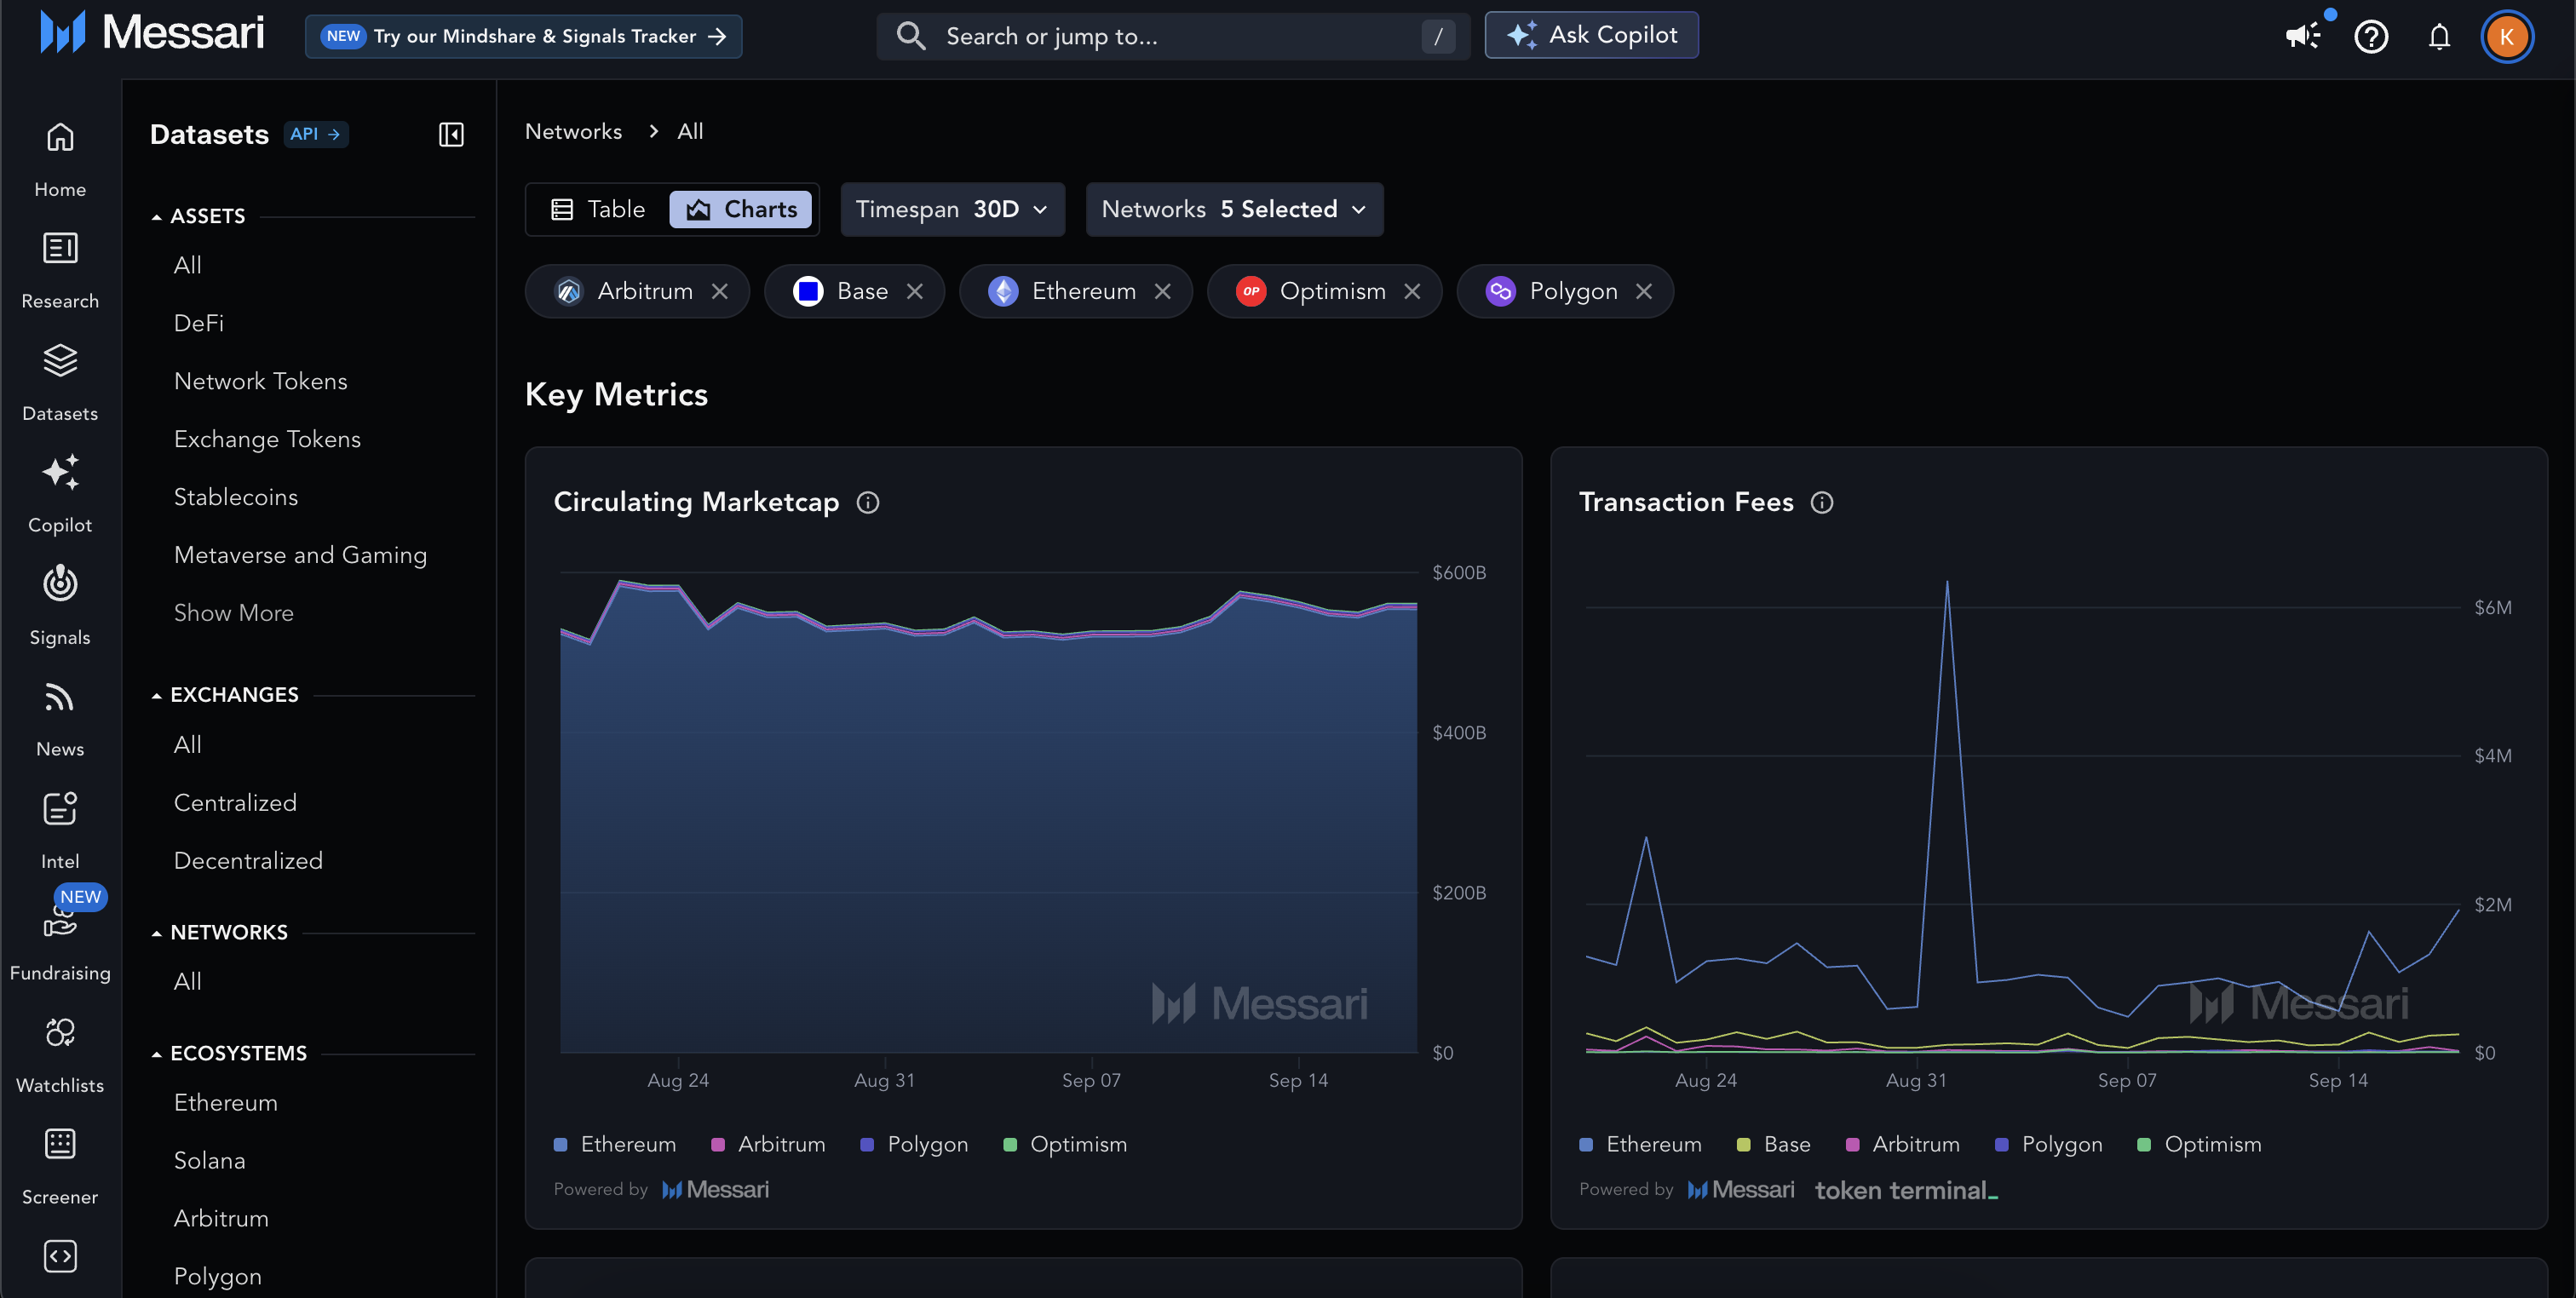
Switch to the Chart format by selecting `Charts` in the upper left corner. The Chart format includes the same data as that found in the Table format, divided into sections such as:
* **Key Metrics**: circulating marketcap, transaction fees, daily transactions, daily active addresses, TVL, stablecoin marketcap, and DEX volume
* **Usage**: new and returning addresses, successful transactions, and unsuccessful transactions
* **Contracts**: total contract calls, new contracts deployed, active contracts, new contracts called, returning contracts called, and unique contract callers
Hover over the tooltip `i` icons to learn more about the metrics being measured. You can also interact with the charts by highlighting or excluding networks using the chart’s interactive legend.
Additional views include:
* **Usage**: transactions and transaction fees, average daily active addresses, average daily new addresses, and average daily returning addresses
* **Contracts**: total contract calls, new contracts deployed, average daily active contracts, average daily new contracts called, average daily returning contracts called, and average daily unique contract callers
At the bottom of each table is a **Total** column which provides the total of each column's metric across all tracked networks.
Note that **Other Networks** is an aggregated group of networks which Messari doesn't yet fully support. Hover over this group's associated tooltip icon to see which networks are included.
### **Chart Format**
Switch to the Chart format by selecting `Charts` in the upper left corner. The Chart format includes the same data as that found in the Table format, divided into sections such as:
* **Key Metrics**: circulating marketcap, transaction fees, daily transactions, daily active addresses, TVL, stablecoin marketcap, and DEX volume
* **Usage**: new and returning addresses, successful transactions, and unsuccessful transactions
* **Contracts**: total contract calls, new contracts deployed, active contracts, new contracts called, returning contracts called, and unique contract callers
Hover over the tooltip `i` icons to learn more about the metrics being measured. You can also interact with the charts by highlighting or excluding networks using the chart’s interactive legend.
 # **Sort & Filter Networks**
## **Sort**
In the Table format, the Networks dataset is sorted by 30D Transaction Fees by default. You can click on column headers to sort by other metrics.
## **Filter**
You can filter networks in both the Table and Chart formats using the following methods:
### **Table Format Filters:**
* **Search Networks**: Search by network name or use the dropdown menus for assets and watchlists.
* **Timespan**: Use the `Span` dropdown to filter data by timespan. It begins on 30D by default. Other options include 7D, 90D, 180D, 1Y, and 3Y.
### **Chart Format Filters:**
* **Select Networks**: The charts include 5 networks by default. Add or remove networks using the dropdown or the `x` icon next to a network's name.
* **Timespan**: As with the table format, filter data by timespan using the `Span` dropdown.
* **Chart-specific filters** Click on a network name in the legend to include or exclude it from a chart.
# **Learn More About a Network**
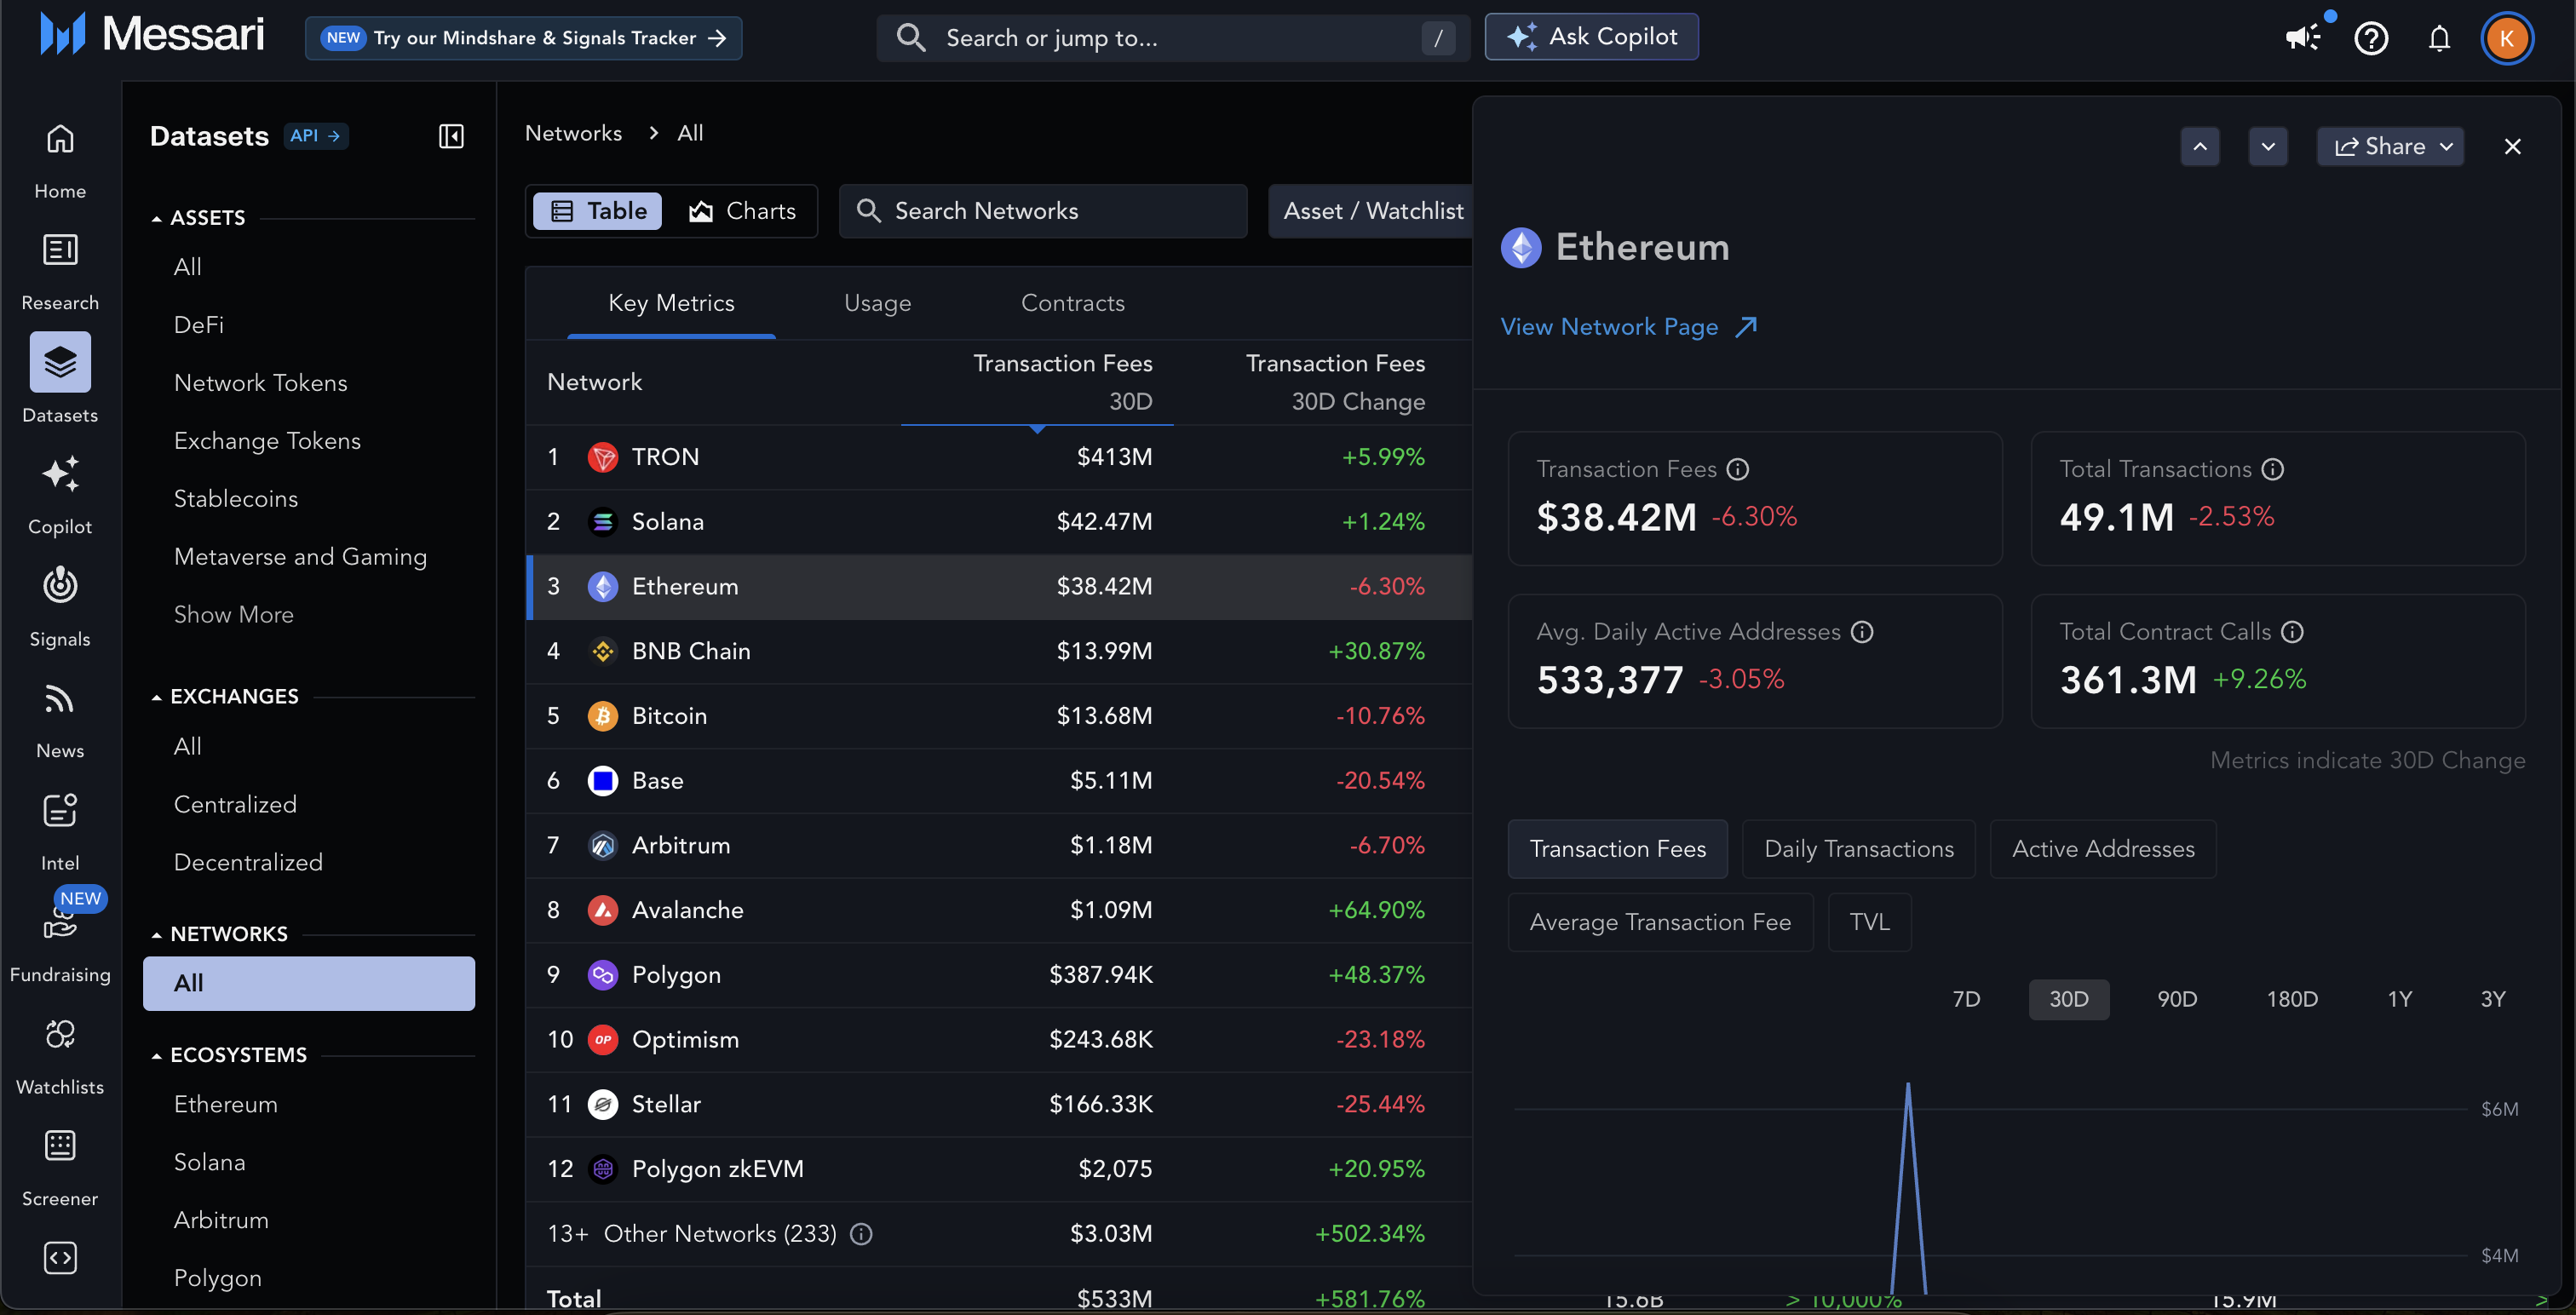
In Table format, click on a network’s name to open the preview panel, which includes important 30D change metrics and charts.
Use the `^` `⌵` icons to scroll through networks, or click `View Network Page` to open its Networks Fundamentals page in an adjacent tab.
# **Sort & Filter Networks**
## **Sort**
In the Table format, the Networks dataset is sorted by 30D Transaction Fees by default. You can click on column headers to sort by other metrics.
## **Filter**
You can filter networks in both the Table and Chart formats using the following methods:
### **Table Format Filters:**
* **Search Networks**: Search by network name or use the dropdown menus for assets and watchlists.
* **Timespan**: Use the `Span` dropdown to filter data by timespan. It begins on 30D by default. Other options include 7D, 90D, 180D, 1Y, and 3Y.
### **Chart Format Filters:**
* **Select Networks**: The charts include 5 networks by default. Add or remove networks using the dropdown or the `x` icon next to a network's name.
* **Timespan**: As with the table format, filter data by timespan using the `Span` dropdown.
* **Chart-specific filters** Click on a network name in the legend to include or exclude it from a chart.
# **Learn More About a Network**
In Table format, click on a network’s name to open the preview panel, which includes important 30D change metrics and charts.
Use the `^` `⌵` icons to scroll through networks, or click `View Network Page` to open its Networks Fundamentals page in an adjacent tab.
 # **Share & Download Network Data**
## **Share**
Click the `Share` icon in the right-hand corner of the preview panel to copy or share a link to the network's Networks Fundamentals page.
## **Download**
Enterprise users can export their dataset in the Table format by clicking the `Download` icon in the top right corner.
***
# **Hot Tips & Best Practices**
* Use the tooltip `i` icons next to column headers or chart titles for additional details.
* You can access a network’s data from its [Project Page](https://docs.messari.io/user-guides/messari-features/project-page) by clicking on [Network Fundamentals](https://messari.io/project/ethereum/network-metrics) and [Statements](https://messari.io/project/ethereum/statements).
* The average or total sum for each metric is provided in the last row in the Table format.
* **Other Networks** includes networks that Messari does not fully support. Hover over its tooltip `i` icon for more details.
* Keyboard shortcuts in preview panel:
* Previous asset `K`
* Next asset `J`
* Close preview panel `Esc`
# **Share & Download Network Data**
## **Share**
Click the `Share` icon in the right-hand corner of the preview panel to copy or share a link to the network's Networks Fundamentals page.
## **Download**
Enterprise users can export their dataset in the Table format by clicking the `Download` icon in the top right corner.
***
# **Hot Tips & Best Practices**
* Use the tooltip `i` icons next to column headers or chart titles for additional details.
* You can access a network’s data from its [Project Page](https://docs.messari.io/user-guides/messari-features/project-page) by clicking on [Network Fundamentals](https://messari.io/project/ethereum/network-metrics) and [Statements](https://messari.io/project/ethereum/statements).
* The average or total sum for each metric is provided in the last row in the Table format.
* **Other Networks** includes networks that Messari does not fully support. Hover over its tooltip `i` icon for more details.
* Keyboard shortcuts in preview panel:
* Previous asset `K`
* Next asset `J`
* Close preview panel `Esc`