Overview
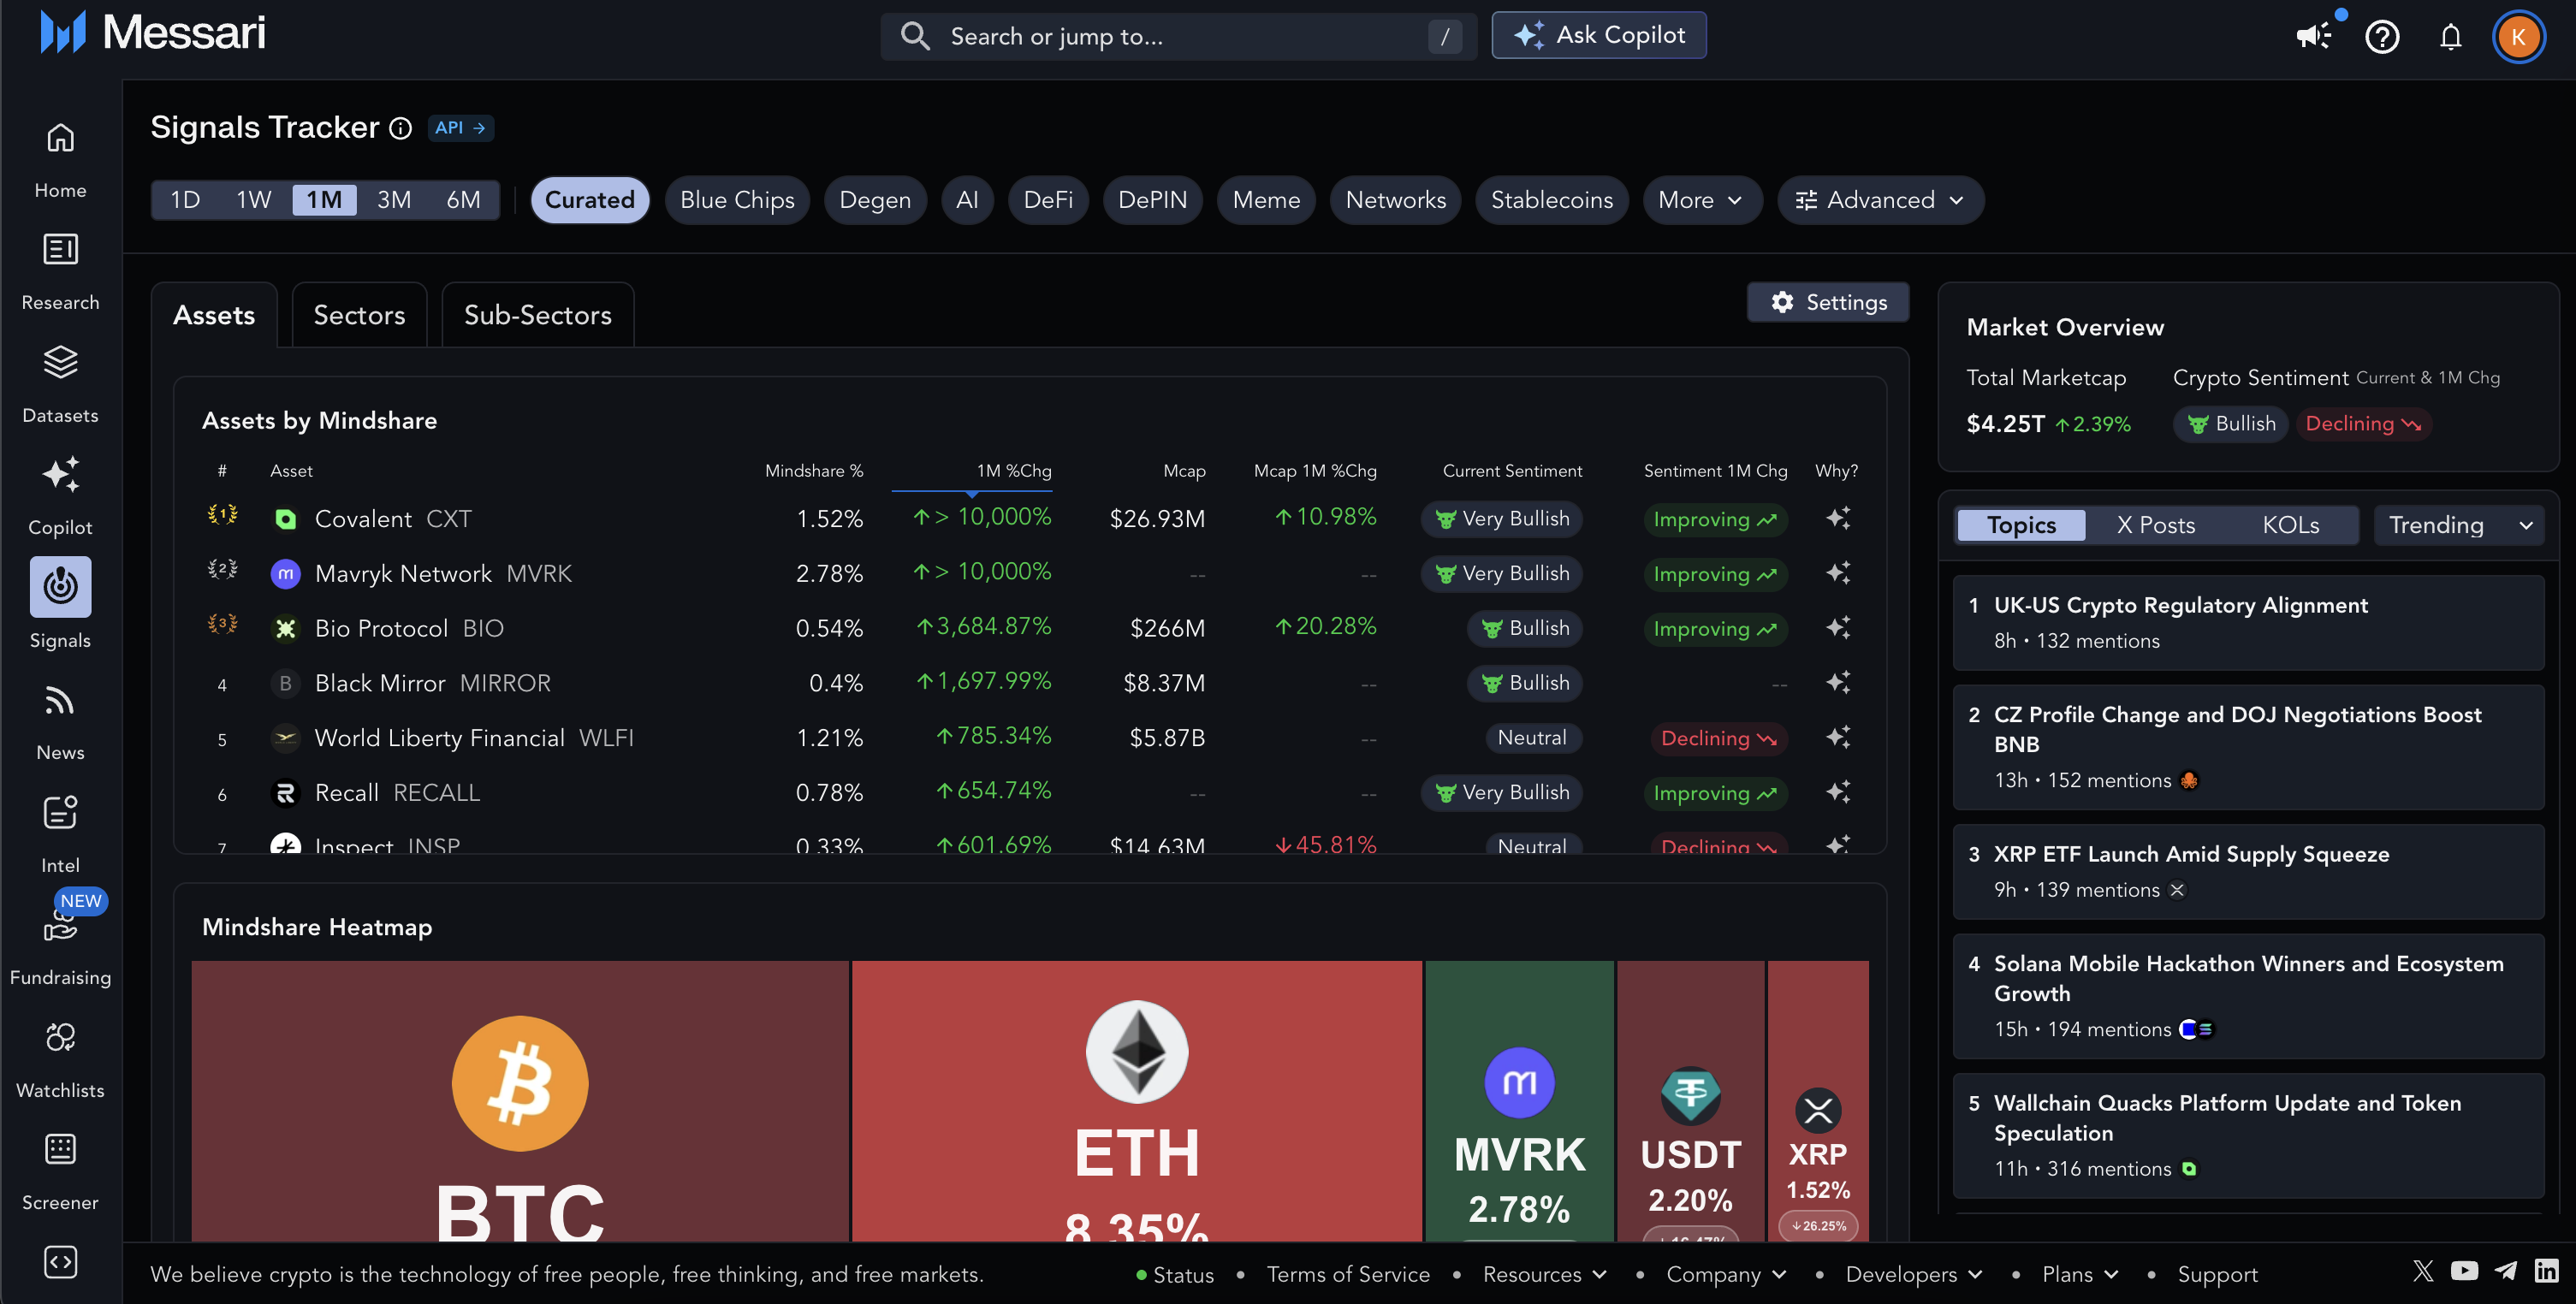
Messari’s Signals tracker quantifies crypto conversations so you can see what the market is talking about across X posts, trending topics, news highlights, and key opinion leaders (KOLs) from a single dashboard. Signals makes it easy for you to keep up to date with the crypto landscape at a glance; understand the “What” (Mindshare), “How” (Sentiment)” and “Why” (Copilot and Topics) in one place.- Mindshare - Measures the magnitude of discussions. For example, an asset with a 1% mindshare means that 1% of conversations are related to that asset.
- Sentiment - Measures the direction of discussions. Identifies if discussions related to the asset are positive or negative, bullish or bearish.
- Copilot & Topics - Provides the “why” explanation behind the Mindshare and Sentiment data so you can get the full picture
How to Access
Signals can be access by pressing the “Signals” icon on the left-side navigation menu or by going to https://messari.io/signals..webp?fit=max&auto=format&n=JsezR_WJW9Cr-E-9&q=85&s=fa0e38ea50b673cd0ec783383c731f4e "image (5).webp")
Permissions
Basic users can use a limited version of Signals, fixed to the 1-month time span only. Enterprise users have full access to everything on Signals across all time spans including 1-day, 1-week, 1-month, 3-month and 6-month time spans.Interface
Mindshare Table
- Assets, Sectors and Sub-sectors by Mindshare (table) – Ranks assets by Mindshare % with the biggest % change so you can see the top Mindshare gainers quickly. Other columns include Market Cap and Current Sentiment (with % change). Use it to spot assets, sectors and sub-sectors gaining the most attention.
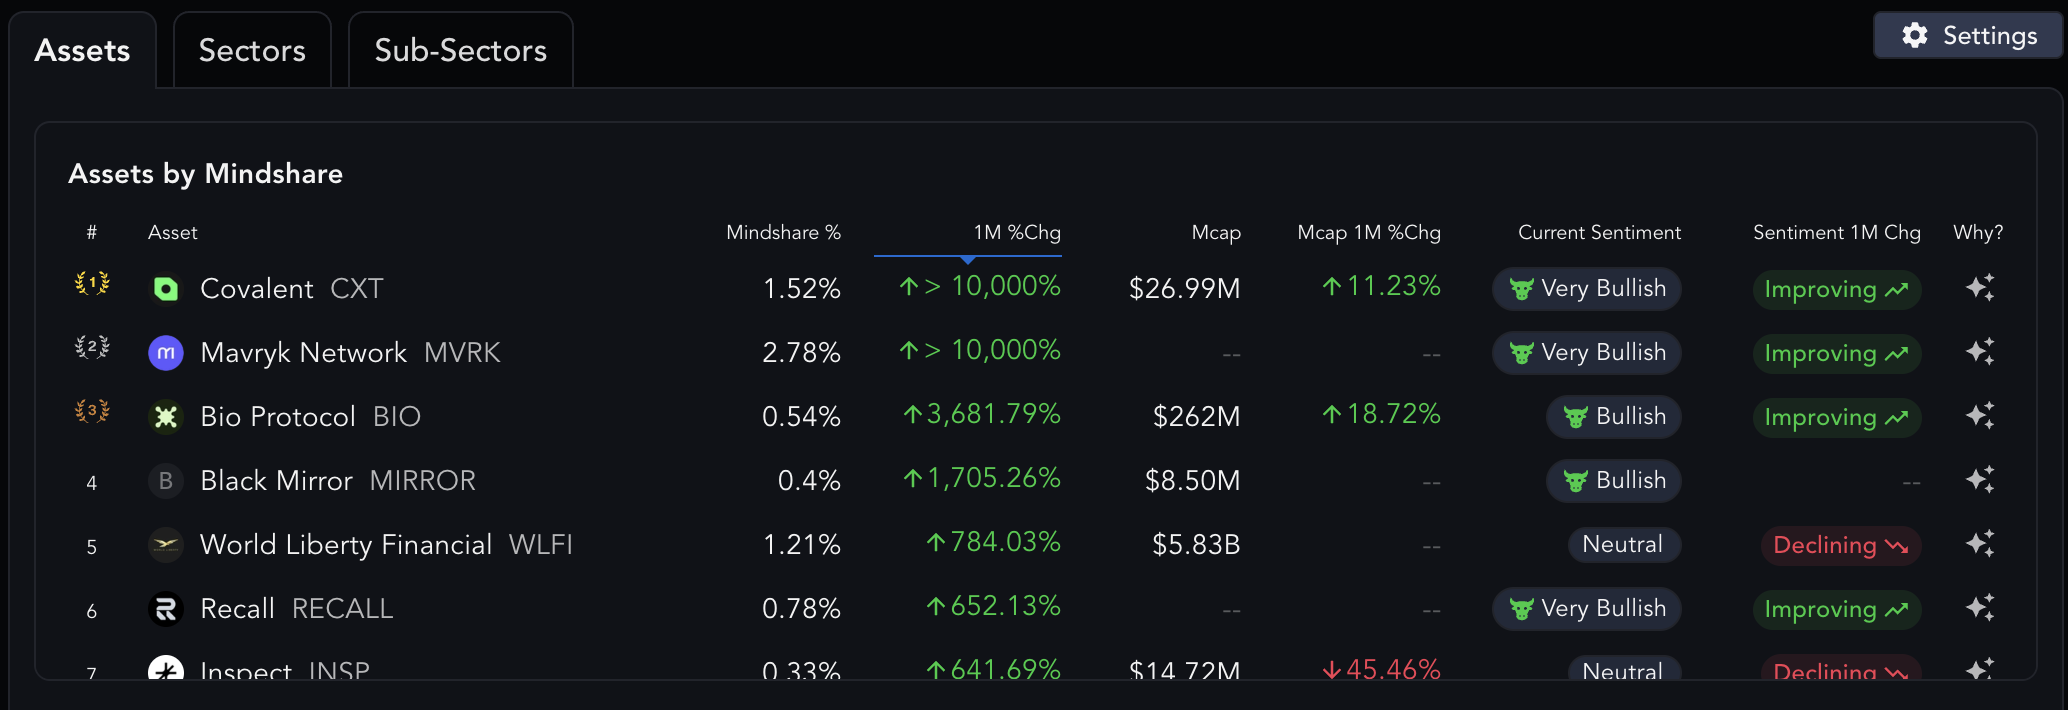
- Why? Column (table) - Hover over the “Why” column to get a preview of what’s driving mindshare for the selected asset, sector or subsector, powered by Messari Copilot.

- Go Deeper - Click the “Go Deeper” button from tooltips to get a more detailed explanation of the reasons why mindshare has been effected, powered by Messari Copilot.
.webp?fit=max&auto=format&n=l6nXOuOkfpHvEcrh&q=85&s=beef41d29319dc9362eb9e5a54ceb7c2 "image (1).webp")
Mindshare Heatmap
- Mindshare Heatmap - Visualize where attention is concentrating and how it’s evolving over time. A larger box on the heatmap represents a larger mindshare. Green boxes indicate a growing mindshare from the previous time period. Red boxes indicate a shrinking mindshare compared to the previous time period.
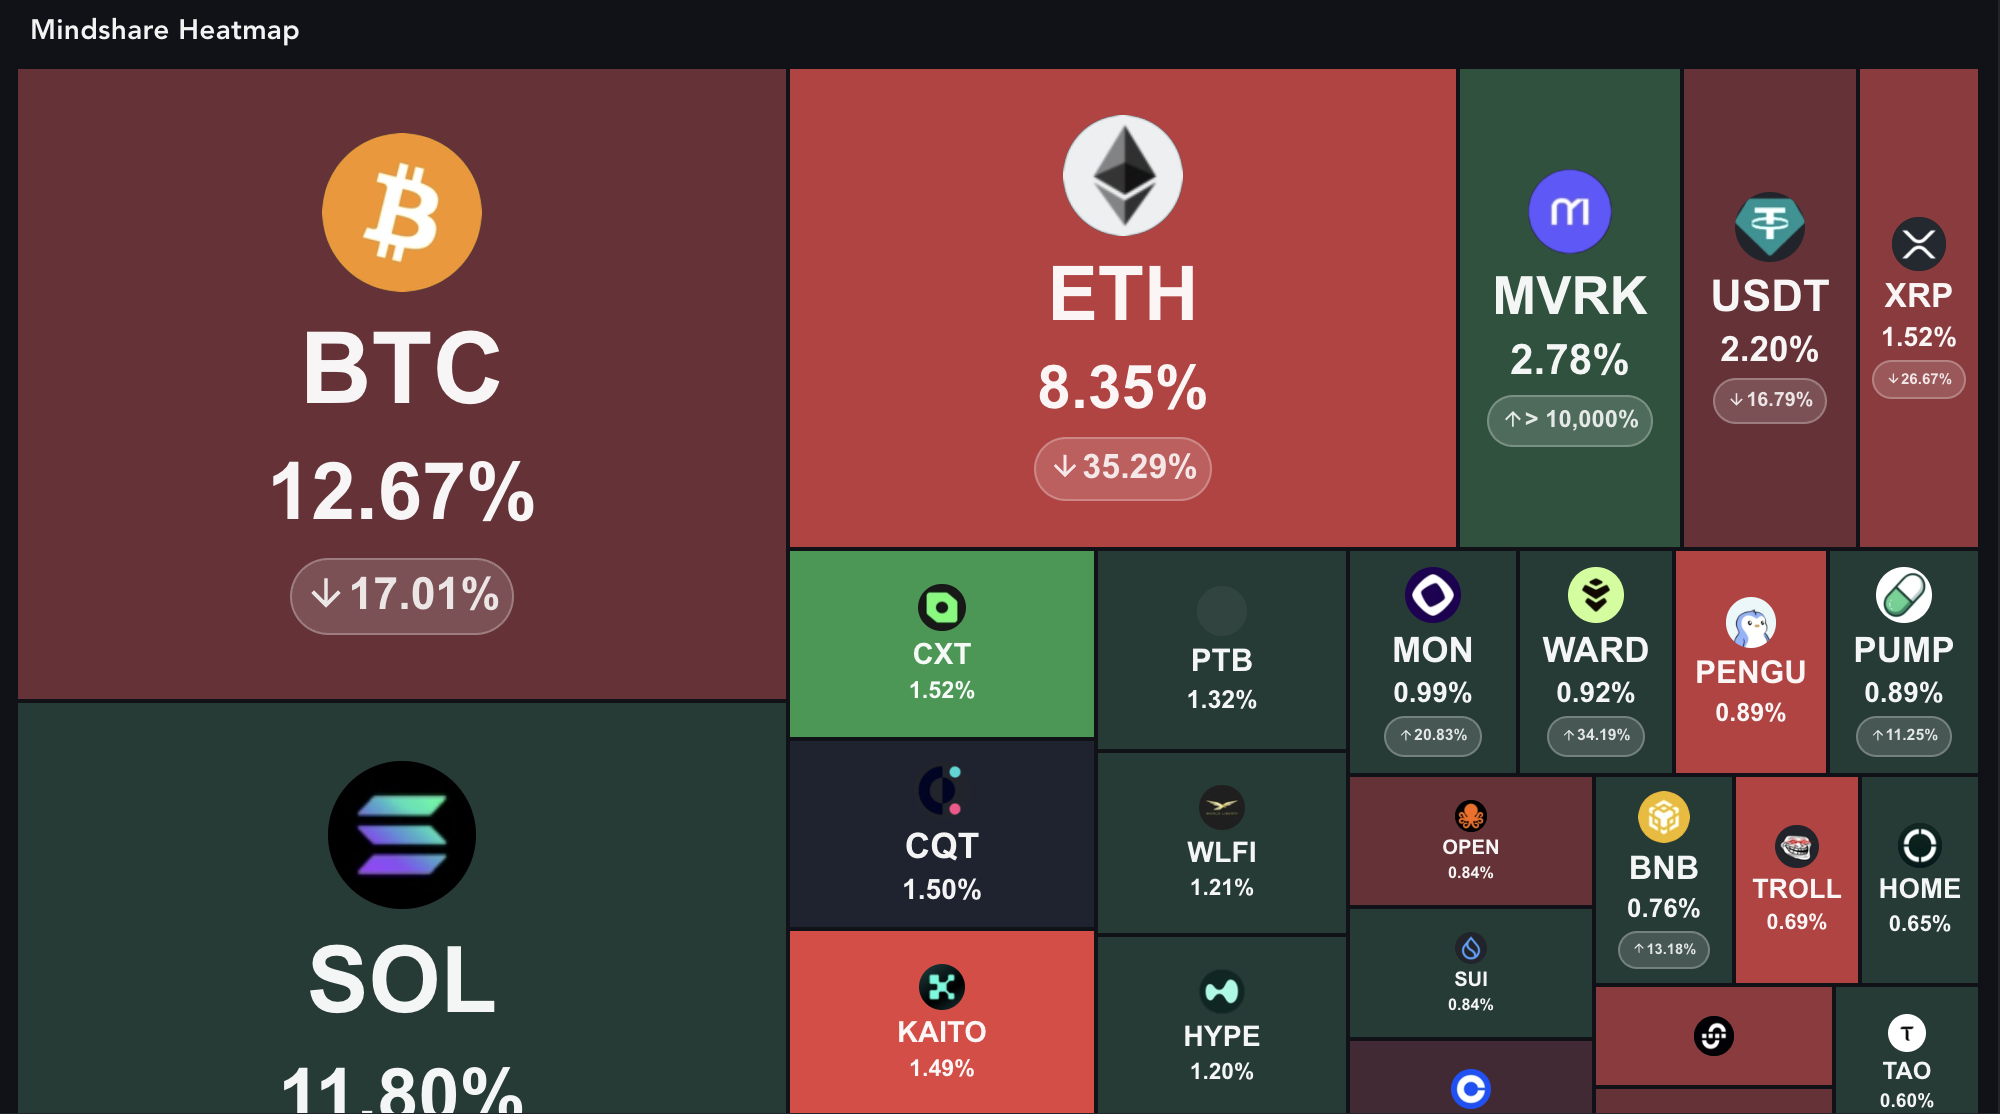
- Heatmap Tooltip - Hovering over a box in the heatmap will display a tooltip containing the Mindshare, Marketcap and Sentiment data. This will also include an explanation behind the “Why” something is being talked about, similar to the “Why” column from the Mindshare Table.
.webp?fit=max&auto=format&n=l6nXOuOkfpHvEcrh&q=85&s=f865fdfbc6bc582e0d779b56993b1401 "image (2).webp")
Topics, X Posts and KOLs Feed

- Topics - Topics are summarized discussions from X/Crypto Twitter and News, making it easy for you to keep up to date with important conversations. Clicking on a Topic will open the Topic Drawer and provide more information regarding the topic, as well as related News Articles and X Posts.

- X Posts - A feed of X Posts sorted by highest trending engagement
.webp?fit=max&auto=format&n=l6nXOuOkfpHvEcrh&q=85&s=8f0a6a01096de60002628b107825b3ab "image (3).webp")
-
KOLs - Ranks Key Opinion Leaders (KOLs) by highest Mindshare. Note that the KOL feed is not effected by page filters.
.webp?fit=max&auto=format&n=l6nXOuOkfpHvEcrh&q=85&s=1997d5422436e0003f060cac68a64fce "image (4).webp")
Filters and Controls

- Time spans – Change time spans (e.g. 1W, 1M, 3M, etc.) to focus on specific time periods you’re investigating
- Quick Filters - Use the quick filters (e.g. Curated, Blue Chips, Degen, AI, DeFi, DePIN, Meme, etc.) to filter for sectors you care about easily
- Advanced Filters - Leverage multiple powerful filters such as marketcap, mindshare rank, sectors and ecosystems filters
Getting Started & Example Use Cases
Here are some example use cases to help get you started and understand the power of Signals. “What has been happening across crypto in the last week?”- Click on the “1W” time span
- Click on the “Curated” quick filter (the default filter)
- View the Mindshare Heatmap to understand the projects with the most mindshare from the week
- Click on the “1M” time span
- Click on the “DeFi” quick filter
- View the Mindshare Table to see which DeFi Projects have gained the most mindshare in the last month
- Click on the “1W” time span
- Click on the “Advanced” filters
- Apply a Marketcap filter between $0 to $100m
- View the Table to see the projects which have gained the most mindshare in the last week below $100m marketcap