
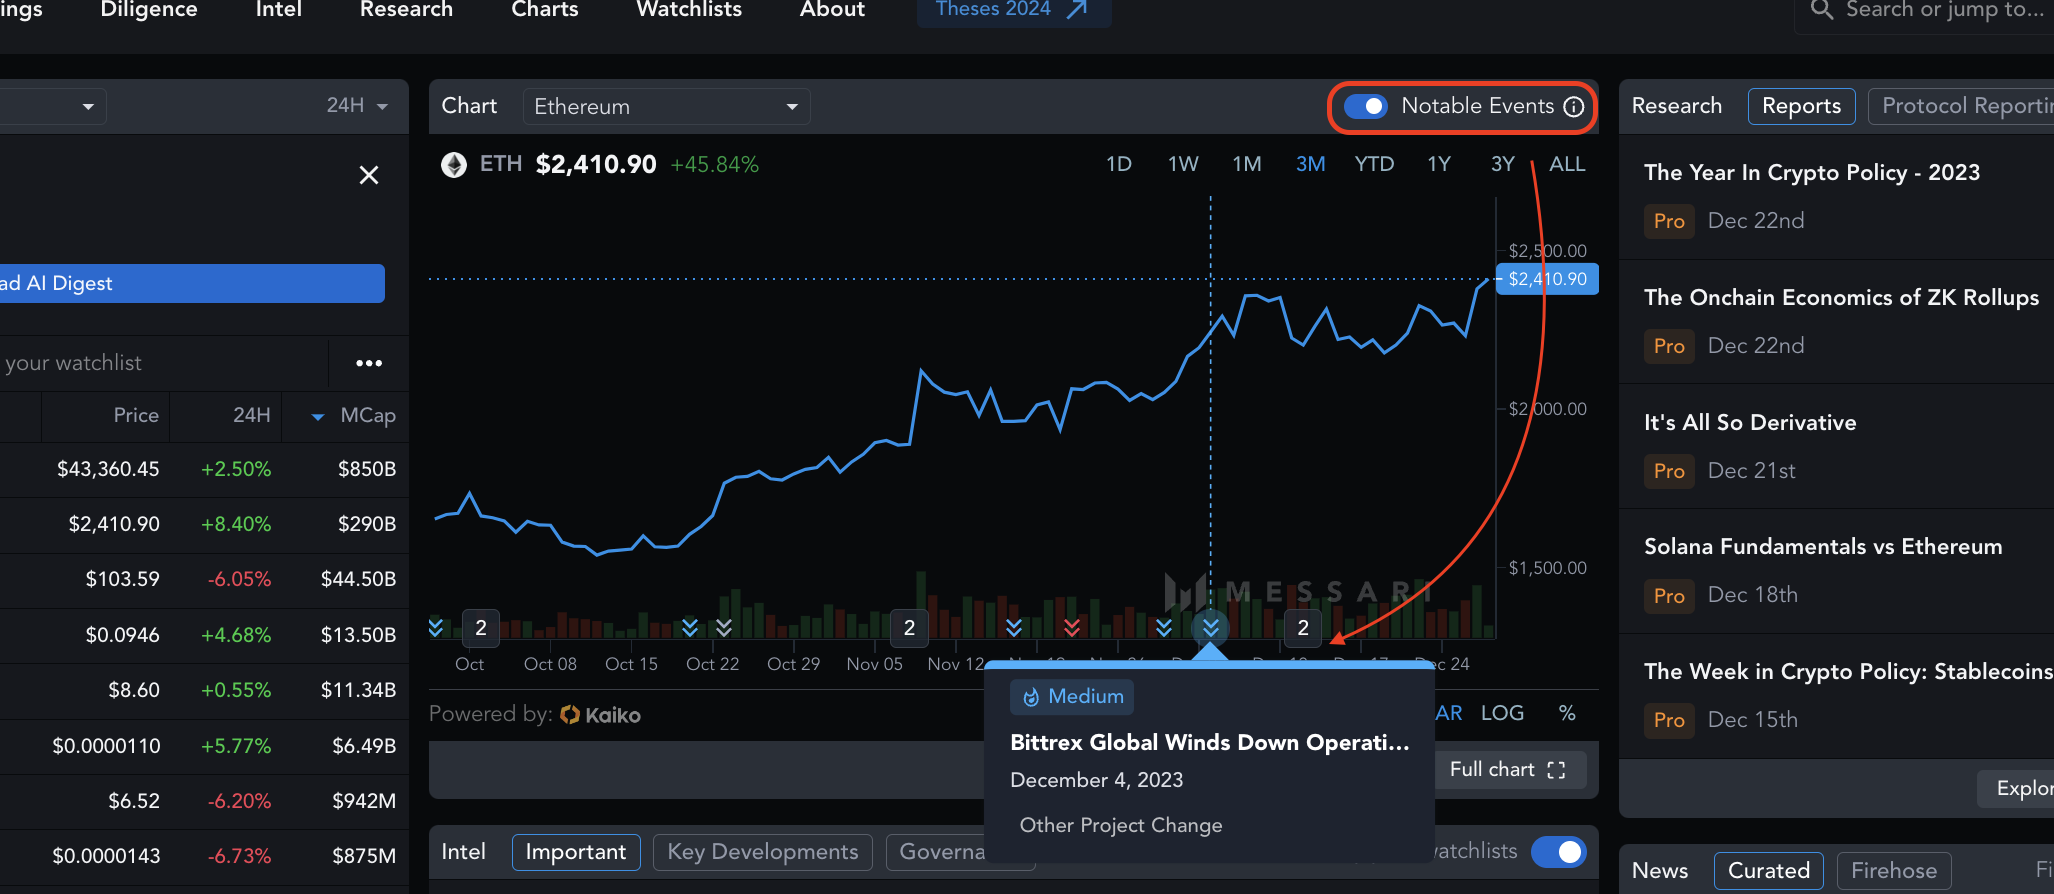
Chart Overlays
Overlay notable events on top of market data charts
Chart overlays are available for Enterprise users on the homepage, asset page, and our asset drawers throughout the Screener tool and the Assets section.
This features allows users to overlay notable events on top of market data charts. Notable events are high-impact, fundamental events that are curated to give the highest signal to stakeholders and asset researchers.
To turn chart overlays on, simply turn on the Notable events toggle located at the top right of any price chart on the homepage, asset page, and our asset drawers throughout the screener tool and the asset section.
To learn more about our event coverage, head over to our Intel documentation.
Updated 7 months ago