
Overview
The Overview section offers a comprehensive summary encompassing the project's core objectives, market data, and related research and events.
The Overview section is comprised of 3 pages:
- Snapshot: An easy-to-navigate overview of a project's core objectives and related sources such as contract addresses and websites; key market data metrics; its price chart; related Messari research, key developments, and news; and similar projects in its associated sector.
- Price Chart: Perform technical analysis on the Project's price chart using Messari's TradingView Charts integration straight from the Project Page.
- Profile: Learn more about a Project's overview and history.
Learn more about the Overview section:
Snapshot
The Snapshot page provides an easy-to-navigate summary of a project's core objectives and related data so that you can quickly learn more about a project.
- Key Metrics: The beginning of the Snapshot page provides key metrics (as applicable) including 24hr Real Volume, Marketcap, All-Time High, Cycle Low, Total Amount Raised, Latest Funding Round, Total Value Locked (TVL), and 30D Revenue.
- Summary: Learn about a project's core objectives. Navigate to a project's associated content, explorers, socials, and additional resources (such as project website, whitepaper, and GitHub).
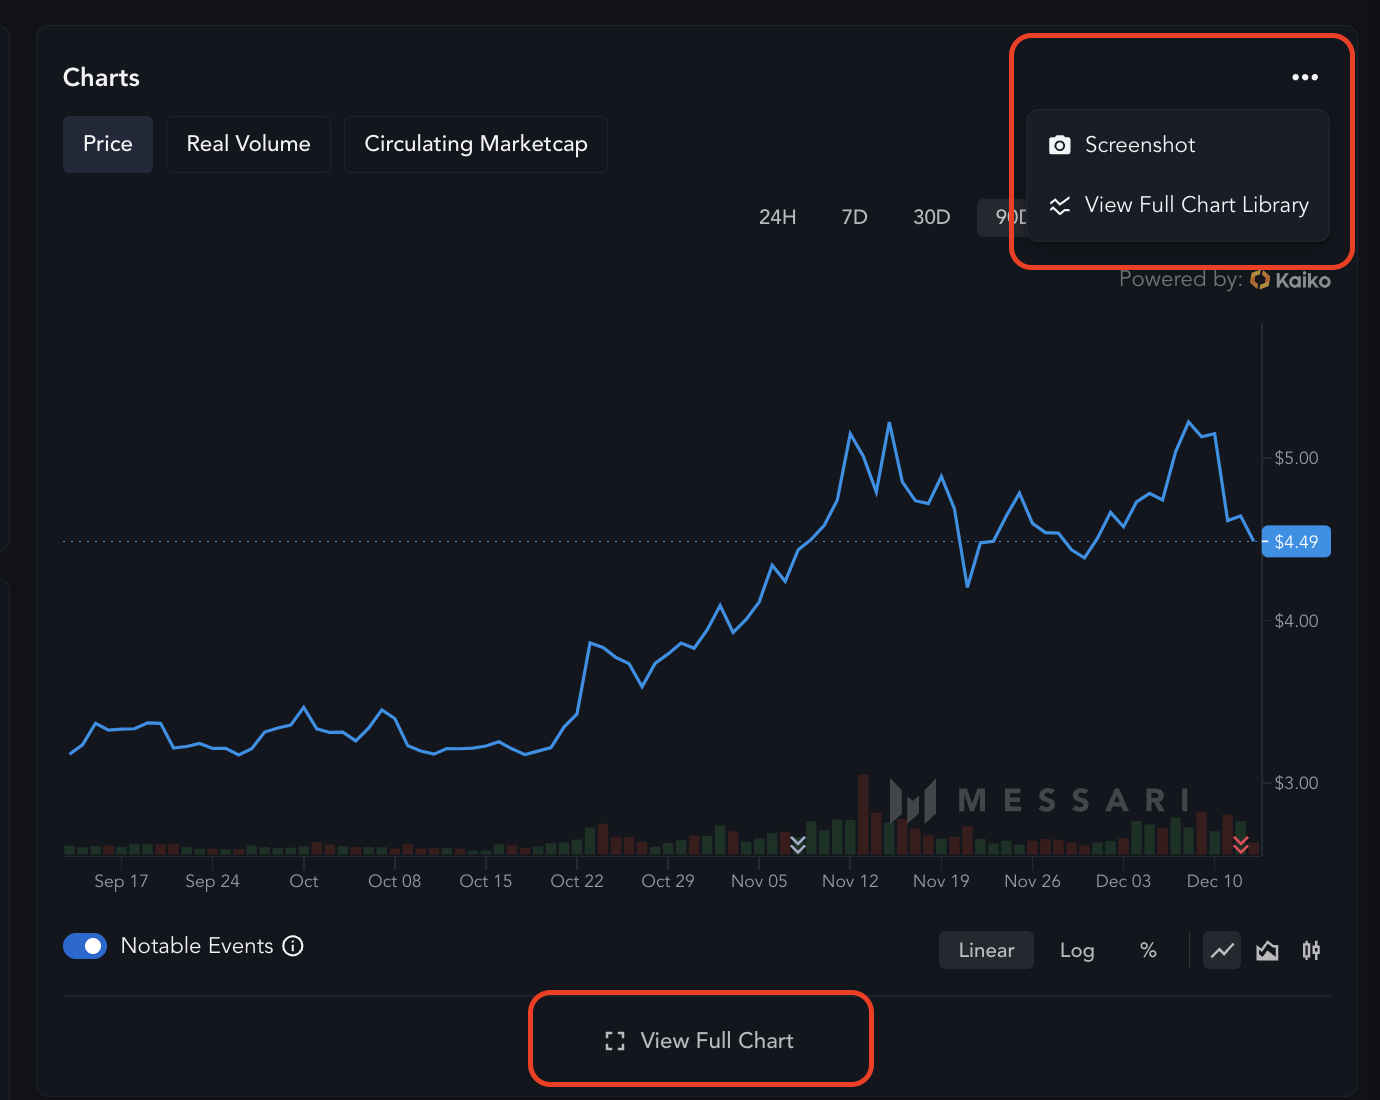
- Chart: Switch between a Price, Real Volume, and Circulating Marketcap chart and customize the timeframe. Enterprise users can toggle on Notable Events to quickly identify price reactions to high-impact, fundamental events. You can take a custom screenshot of the chart or view the project's full chart library using the menu on the top right corner of the Chart. Dive deeper in your chart analysis by clicking on "View Full Chart," which will take you to the project's Price Chart.
- Curated Feed, Notable Events, Curated News, Governance: The most recent related News, Key Developments, and Governance activity for the project. See more by clicking "Track All Events," "Track All News," or "Track All Proposals" to go to the Project Page's associated Key Developments, News, or Governance section.
- ROI & Markets: Quickly scan to determine how an asset is performing and where it is trading.
- Research: View the most recent related Messari research. Click "Explore All Research" to go to the Project Page's associated Research section.
- Similar Projects: View a list of projects in the same sector to quickly discover and learn more about similar projects.
Price Chart
Perform technical analysis on the Project's price chart using Messari's TradingView Charts integration straight from the Project Page. Learn more about customizing and saving your chart on here.
Profile
The Profile page allows you to learn more about a Project's overview and history.
Resources
Updated 7 months ago