
Navigating Network Fundamentals Pages
An overview of the Network Fundamentals Pages section within Messari Project Pages.
Overview
Each network has an in-depth page to explore and visualize their specific metrics. This page allows you to focus on a single network and provides granular data regarding that network.
The Network Fundamental Pages consist of the following sections:
Overview: Modules and Charts for the individual network.
Historical Data: Table of historical metrics.
Methodology: Description and formulas for metrics used.
Overview Page
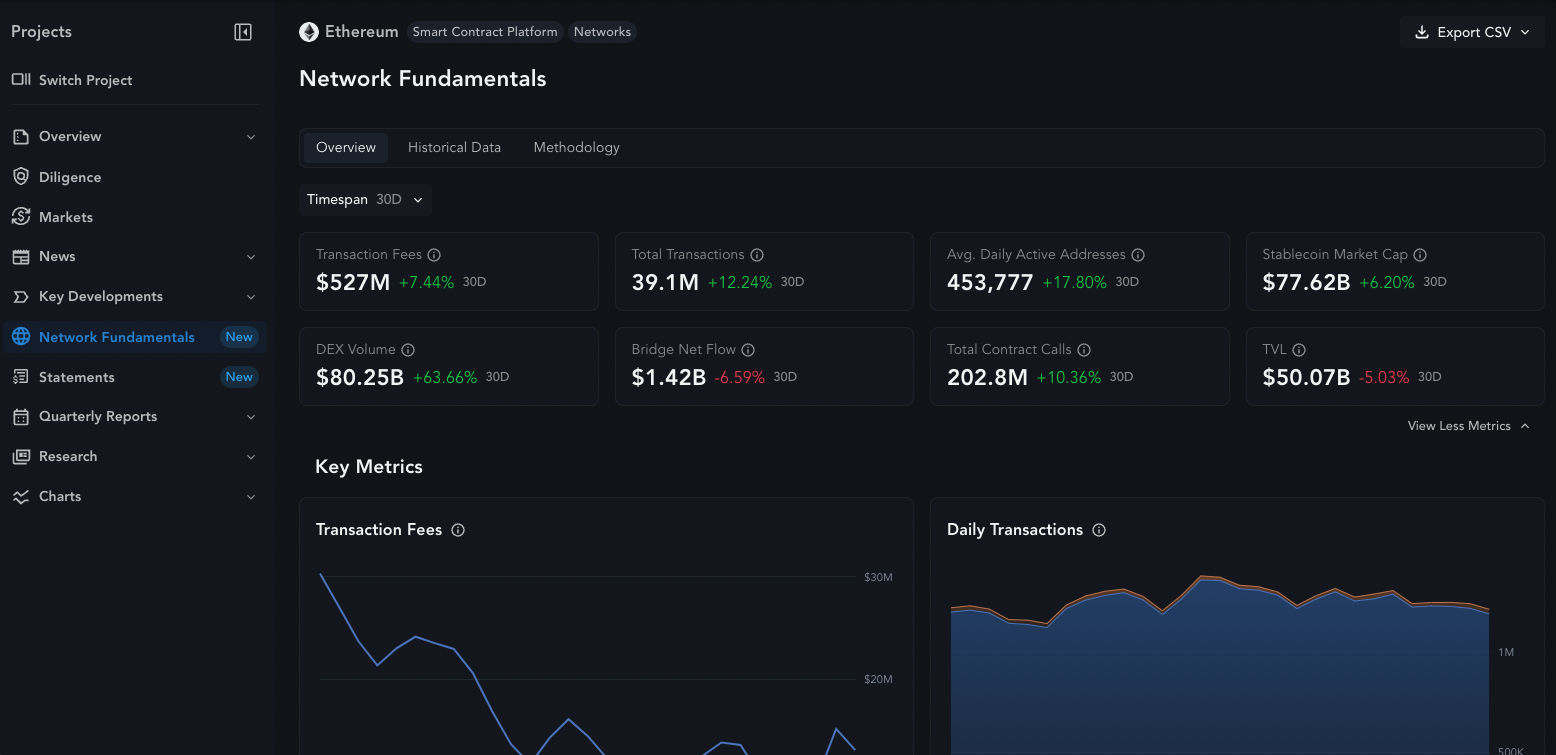
Overview page is the landing page for Network Fundamentals Page. Here you will see Key Metrics modules at the top followed by charts for the specific network.

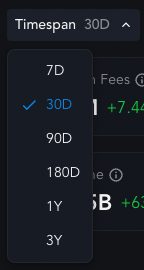
There is a timespan drop down that changes timespan for all charts and modules on the page.
Overview Modules
The key metrics module show the numbers for the current timespan selected and the percentage change in the metrics the prior timespan to the current one.
The metrics in the modules are:
- Transaction Fees: Fees paid for transactions within the selected timespan, denominated by USD.
- Total Transactions: The number of transactions within the selected timespan.
- Average Active Addresses: The average daily number of unique wallet addresses sending transactions within the selected timespan.
- Stablecoin Marketcap:_ Current USD value of all USD stablecoins that have been minted or bridged onchain.
- DEX Volume: USD value of all swaps on DEXs within the selected timespan.
- Bridge Net Flow: USD value of assets that are bridged on the network minus assets bridged off the network within the timespan selected.
- Total Contract Calls: The number of contract calls made within the selected timespan.
- TVL: The current USD value of assets deposited into DeFi protocols.

Overview Charts
Here you can visualize metrics for the specific network. Timespan for y-axis changes with the timespan drop down.
The following charts are currently supported:
Key Metrics Section
Transaction Fees: Line chart showing daily Transaction Fees.
Daily Transactions: Stacked area chart showing daily successful and unsuccessful transactions.
Active Addresses: Stacked area chart showing daily new and returning addresses.
Average Transaction Fee: Line chart showing daily average of Transaction Fees.
TVL: Area chart showing daily TVL.
Contracts Section
Contracts: Stacked area chart showing daily new and returning contracts called. Overlayed with a line chart for daily unique contract callers.
New Contracts Deployed: Line chart showing daily new contracts deployed.
DeFi Section
Stablecoin Marketcap: Stacked area chart showing daily DEX volume.
DEX Volume: Stacked area chart showing daily DEX volume.
Bridge Flow: Stacked bar chart showing USD value of bridge deposit and withdraw volume. Line chart showing USD value of Net Volume
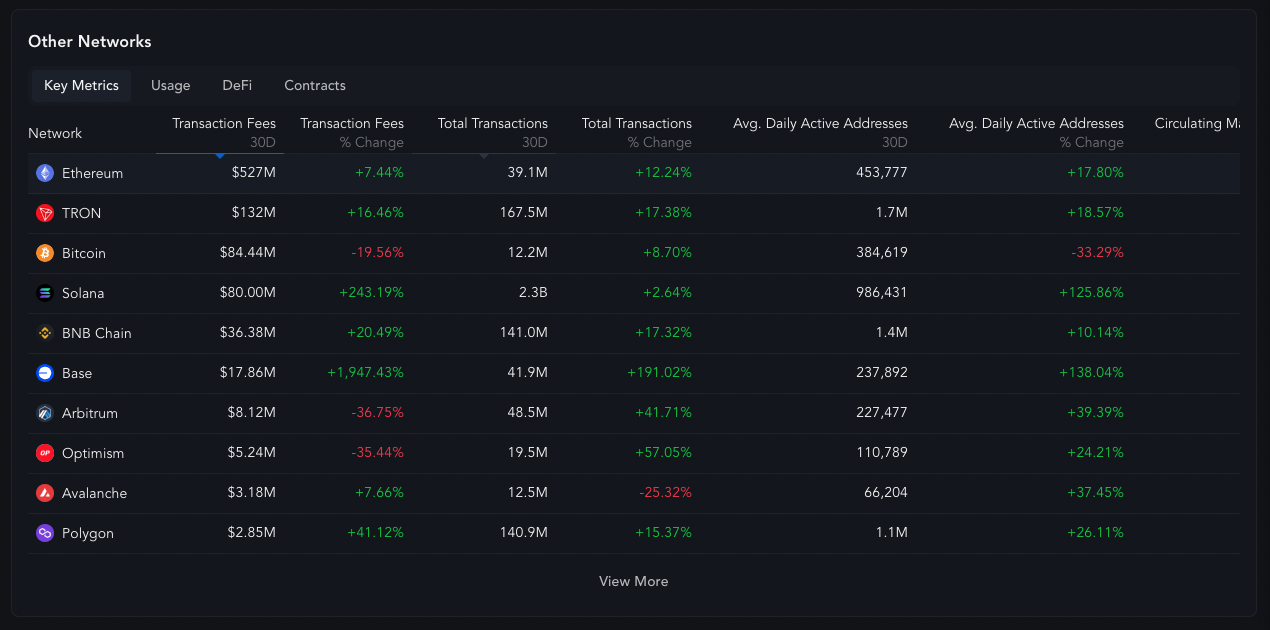
Other Networks
Other networks tables is a condensed form of the explorer page table, limiting the number of metrics displayed to 10. The network of interest in pinned to the top, followed by other supported networks. The metrics are divided into the following tables: Key Metrics, Usage, DeFi, and Contracts.
Historical Data Page
The historical data page shows metrics for specific dates for this network. The timespan toggle provides modifies the number of rows to display each date within the timespan selected. The metrics are divided into category tables, the same as explorer page table view, specifically: Key Metrics, Usage, DeFi and Contracts.

This data can be exported by the Export CSV dropdown at the top of the page.

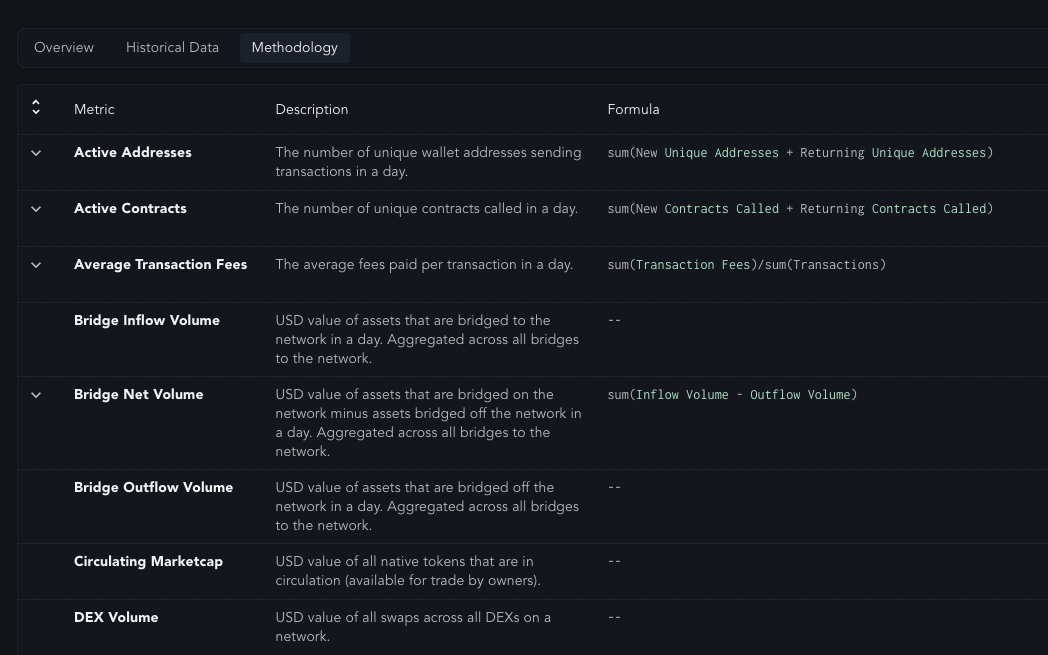
Methodology Page
The methodology page is a repository for definitions and formulas for how metrics are calculated. It provides clarity as to what each metric means and how they are derived. In the table you can view: Metric Name, Definition, and Formula.
Updated 4 months ago